Have you ever wondered how your email results compare to those in your industry? Or what kind of open rates you should expect? Is your click rate above or below the industry average?

Email deliverability is complex, and there isn't always a good way to know how your campaigns are doing or how to improve. Knowing email marketing benchmarks can be critical to determine your current campaign’s performance and forecast results.
When you know your industry average, you can analyze your campaigns using HubSpot’s email tracking tool and devise strategies to optimize them for 2023.

Email Marketing Benchmarks
Email marketing benchmarks are critical for the health of your email sends. Benchmarks allow you to see how your specific campaigns compare to the standards of your industry (Surprise! Each industry has different benchmarks). In turn, you can discover opportunities to improve your email strategy and work on achieving even better results.

Email Marketing Planning Template
Organize your email marketing strategy and metrics with this free template.
- Gather data
- Summarize results
- Manage A/B tests
- And More!
Using the data from Mailerlite’s report, we’ll look at email benchmarks for various industries and provide resources for how you can improve each rate.
The report was prepared after analyzing 40,000 Mailerlite customers in the U.S.A., U.K., and Canada to calculate each industry's email open, click-through, bounce, and unsubscribe rates in 2022.
This data was pulled from approved accounts and only those sending batch email campaigns. This data only includes campaigns with over 10 sends and the most relevant industries. The final dataset size was 1 million.
Average Email Open Rates by Industry
So what’s a good open rate for your industry? Use the chart and table below to check your industry’s benchmark from Mailerlite.
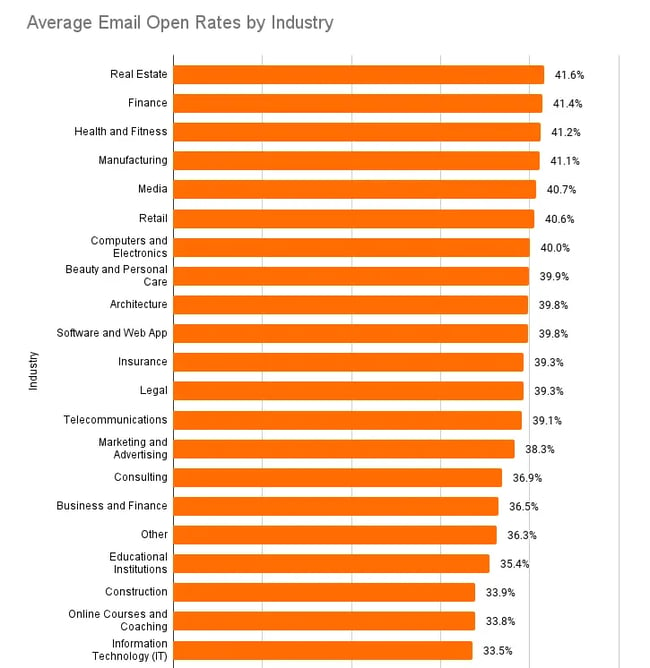
*Other: A catch-all used during sign-up if the customer didn’t fit into one of the listed categories.
|
Industry |
Open rate |
|
Real Estate |
41.6% |
|
Finance |
41.4% |
|
Health and Fitness |
41.2% |
|
Manufacturing |
41.1% |
|
Media |
40.7% |
|
Retail |
40.6% |
|
Computers and Electronics |
40.0% |
|
Beauty and Personal Care |
39.9% |
|
Architecture |
39.8% |
|
Software and Web App |
39.8% |
|
Insurance |
39.3% |
|
Legal |
39.3% |
|
Telecommunications |
39.1% |
|
Marketing and Advertising |
38.3% |
|
Consulting |
36.9% |
|
Business and Finance |
36.5% |
|
Other |
36.3% |
|
Educational Institutions |
35.4% |
|
Construction |
33.9% |
|
Online Courses and Coaching |
33.8% |
|
Information Technology (IT) |
33.5% |
We found that the average open rate across all industries is 38.49%.
The best way to get value from open rates is by using them as a comparative metric. For instance, comparing the open rates of this week‘s sent emails to last week’s (both to the same lists) might give you some insight since the variables are somewhat controlled.
The report shows that the real estate and finance industries have the highest open rates. Interestingly enough, the IT industry has the lowest open rate.
The best way to improve your open rate is by following the subject line best practices (includes examples!), tracking which performed better, and optimizing others based on results.
What is the average email open rate for electronics companies?
From Mailerlite’s sample, the average open rate for the computers and electronics category is 39.98%. This category may include companies in any of the following: computer games, computer hardware, consumer electronics, electrical or electronic manufacturing, nanotechnology, semiconductors, or technology.
What is the average email open rate in the business industry?
The average open rate for the business category is 36.49%. This may include business services such as writing and editing, small businesses, and more.
What is the average email open rate for software companies?
The sample's average open rate for the software category is 39.77%.
What is the average email open rate for media companies?
The average open rate for the media category is 40.67%. This category includes businesses involving online media or publishing.
What is the average email open rate for internet and telecom companies?
The average open rate for the internet and telecom category is 39.13%. This category includes broadcast media, internet, telecommunications, and wireless.
What is the average email open rate for healthcare companies?
The average open rate for the healthcare category is 41.23%. Companies in this category include alternative medicine, hospital and healthcare, individual and family services, medical devices, medical practice, mental health care, and veterinary.
What is the average email open rate for retail and shopping companies?
The average open rate for the retail category is 40.56%. Apparel and fashion, arts and crafts, consumer goods, consumer services, food and beverages, luxury goods and jewelry, retail, sporting goods, supermarkets, and wine and spirits are all examples of businesses that make up this category.
What is the average email open rate for finance companies?
The average open rate for the finance category is 41.44%. It includes accounting, banking, capital markets, financial services, investment banking, investment management, venture capital, and private equity.
What is the average email open rate for manufacturing companies?
The average open rate for the manufacturing category is 41.07%. This category refers to companies in goods production.
What is the average email open rate for education companies?
The average open rate for the education category is 35.43%. This category includes businesses in the following areas: civic and social organization, e-learning, education management, higher education, libraries, primary or secondary education, or program development.
What is the average email open rate for real estate companies?
The average open rate for the real estate category is 41.59%.
Email Marketing Planning Template
Organize your email marketing strategy and metrics with this free template.
- Gather data
- Summarize results
- Manage A/B tests
- And More!
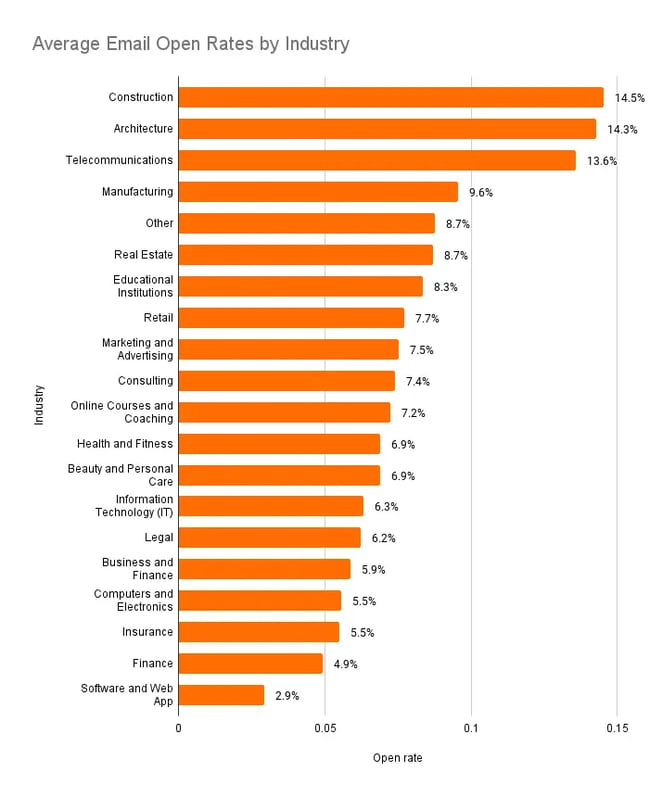
Average Email Click-Through Rates by Industry
Click-through rates are the percentage of people who clicked a link in your email out of the people who opened your email. Use the chart and table below to check your industry’s benchmark from Mailerlite.
|
Industry |
CTR |
|
Construction |
14.5% |
|
Architecture |
14.3% |
|
Telecommunications |
13.6% |
|
Manufacturing |
9.6% |
|
Other |
8.7% |
|
Real Estate |
8.7% |
|
Educational Institutions |
8.3% |
|
Retail |
7.7% |
|
Marketing and Advertising |
7.5% |
|
Consulting |
7.4% |
|
Online Courses and Coaching |
7.2% |
|
Health and Fitness |
6.9% |
|
Beauty and Personal Care |
6.9% |
|
Information Technology (IT) |
6.3% |
|
Legal |
6.2% |
|
Business and Finance |
5.9% |
|
Computers and Electronics |
5.5% |
|
Insurance |
5.5% |
|
Finance |
4.9% |
|
Software and Web App |
2.9% |
Click-through rate (CTR) is likely the first answer you'll get when you ask an email marketer what metrics they track.
I like to call it the “day-to-day email marketing metric” because it lets you calculate performance for every email you send — making it an intelligent metric to optimize.
The average CTR across industries is 8.29%. The construction and media industries led the pack for the highest CTR. The software industry came in last with the lowest CTR at 2.91%.
Email reputation is built based on high positive engagement while reducing negative engagements. To improve your email click-through rates, follow our CTR best practices.
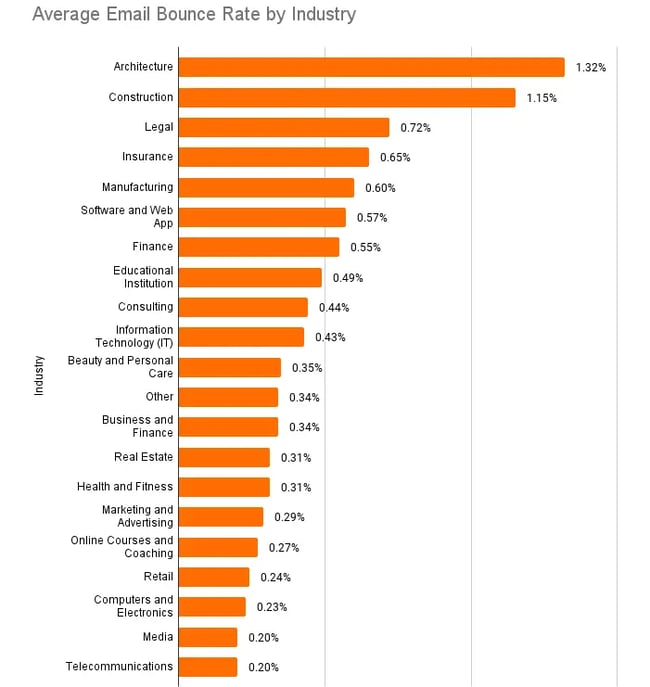
Average Email Bounce Rate by Industry
Bounce rates are the percentage of your total emails sent that could not be successfully delivered to the recipient's inbox. Learn how to calculate your bounce rate here.
Hard bounces result from invalid, closed, or non-existent email addresses, and these emails will never be successfully delivered. Too many hard bounces make you look like a bad marketer to email inbox providers, and you lose trust. They will put your emails in the spam folder if they don't trust you.
So, if you don’t want your emails to land in your recipients’ spam folders, ensure you have a low bounce rate.
Use the chart and table below to check your industry’s benchmark from Mailerlite.
|
Industry |
Bounce rate |
|
Architecture |
1.32% |
|
Construction |
1.15% |
|
Legal |
0.72% |
|
Insurance |
0.65% |
|
Manufacturing |
0.60% |
|
Software and Web App |
0.57% |
|
Finance |
0.55% |
|
Educational Institution |
0.49% |
|
Consulting |
0.44% |
|
Information Technology (IT) |
0.43% |
|
Beauty and Personal Care |
0.35% |
|
Other |
0.34% |
|
Business and Finance |
0.34% |
|
Real Estate |
0.31% |
|
Health and Fitness |
0.31% |
|
Marketing and Advertising |
0.29% |
|
Online Courses and Coaching |
0.27% |
|
Retail |
0.24% |
|
Computers and Electronics |
0.23% |
|
Media |
0.20% |
|
Telecommunications |
0.20% |
We found that the architecture and construction industry had the highest hard bounce rate, yet the telecommunication industry had the lowest. The average hard bounce rate across each industry is 0.48%.
While you can’t do much about invalid email addresses other than remove them, keeping an eye out for inactive subscribers is crucial. You should regularly clean your email list and remove inactive subscribers to keep your bounce rate low.
“Invalid, abuse, and temporary emails will affect your sender reputation, so it’s best to weed them out,” says Liviu Tanase, CEO of ZeroBounce. “Your desire to grow your list is only natural, but you can’t afford to expand it at all costs. Emailing only valid and active addresses allows you to connect with people who care about your brand, and that’s what every email marketer wants.”
Using HubSpot’s email tracking tool, you can track who’s opening your emails and remove those who haven’t for months.
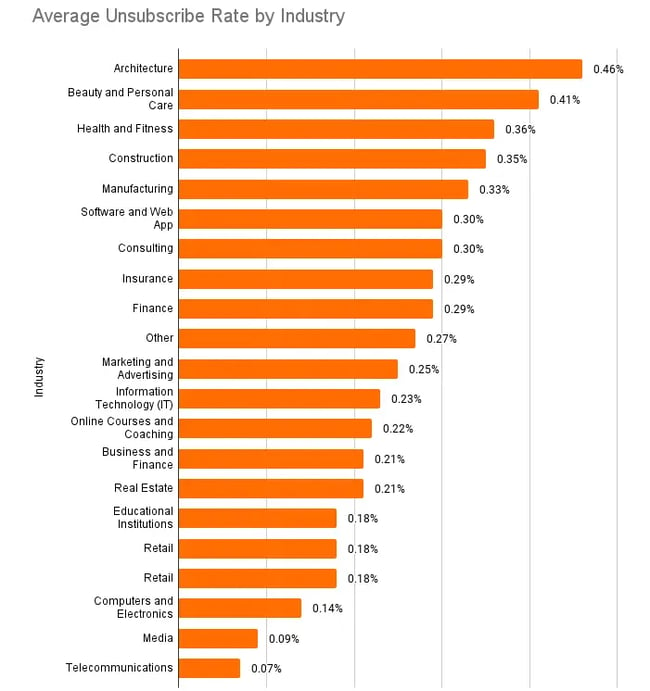
Average Unsubscribe Rate by Industry
Unsubscribe rates are the percentage of subscribers who have chosen to no longer receive your messages. Use the chart and table below to check your industry’s benchmark from Mailerlite.
|
Industry |
Unsubscribe rate |
|
Telecommunications |
0.07% |
|
Media |
0.09% |
|
Computers and Electronics |
0.14% |
|
Retail |
0.18% |
|
Educational institution |
0.18% |
|
Real Estate |
0.21% |
|
Business and Finance |
0.21% |
|
Online Courses and Coaching |
0.22% |
|
Information Technology (IT) |
0.23% |
|
Marketing and Advertising |
0.25% |
|
Legal |
0.26% |
|
Other |
0.27% |
|
Finance |
0.29% |
|
Insurance |
0.29% |
|
Consulting |
0.30% |
|
Software and Web App |
0.30% |
|
Manufacturing |
0.33% |
|
Construction |
0.35% |
|
Health and Fitness |
0.36% |
|
Beauty and Personal Care |
0.41% |
|
Architecture |
0.46% |
As with the open rate, the unsubscribe rate isn’t a reliable picture of the health of your email list. Many subscribers tired of receiving your brand's email messages won’t bother to go through the formal unsubscribe process. They’ll simply stop opening, reading, and clicking on your email messages.
That's why measuring subscriber engagement by click-through and conversion rates is much more effective. From there, you can look for unengaged subscribers and remove them at some point.
Checking your monthly unsubscribe rate helps calculate your overall list growth rate, so watch it regularly.
The average unsubscribe rate across all industries is 0.26%. We found that the architecture industry has the highest average unsubscribe rate. The telecommunications industry comes in with the lowest unsubscribe and hard bounce rates.
Is your unsubscribe rate alarming? Check out these nine ways to decrease your unsubscribe rate.
Frequently Asked Questions About Email Subject Lines
If you find that you're falling below benchmarks or simply want to reach that next level in your email marketing, the following questions and answers may help.
How do I improve my email open rates?
The lowest-hanging fruit is personalizing your subject line so it’s unique to the specific prospect.
For instance, if your recipient’s LinkedIn profile says they love sailing, your subject line might read “Fellow sailing enthusiast // question about Company X” or “This is naut(ical) your typical sales email.” Corny? Yes. Effective? Also yes.
What are the best practices for email subject lines?
- Keep it short and sweet. Fewer words make it easier to understand.
- Tailor it to the person you're emailing. Research, research, research. Include a phrase or information to show that your email is relevant.
- Tell them what to expect if they open your email. If they know what to expect — and it‘s what they want — they’ll be more likely to open it.
- Don't use all caps or overuse exclamation points. An outreach email is never life or death, so a subject line that says “IMPORTANT!!!” will only hurt your credibility and make you seem desperate.
For 23 simple tips on improving your open rate, read this blog post here.
What are examples of great email subject lines?
Not to beat a dead horse, but personalization is key — so rather than copying and pasting these examples, use them as inspiration.
- “Aja, thought you’d be interested in new data on Google rankings.”
- “Cal Poly connection”
- “My favorite part of your recent article”
- “Identified some content opportunities for you.”
And here are 150+ more awesome subject lines you can take inspiration from for your campaigns.
How do I personalize subject lines?
Personalize your subject lines by using the recipient's name, mentioning their company, mentioning someone they know, or referring to a personal tidbit about them.
Email Marketing Planning Template
Organize your email marketing strategy and metrics with this free template.
- Gather data
- Summarize results
- Manage A/B tests
- And More!
Email Click-Through Rate Statistics and Best Practices
It's good to talk about improving email click-through rates — but how is it actually done? Here are some statistics and best practices to help you optimize your email click-through rate and communicate better with your prospects.
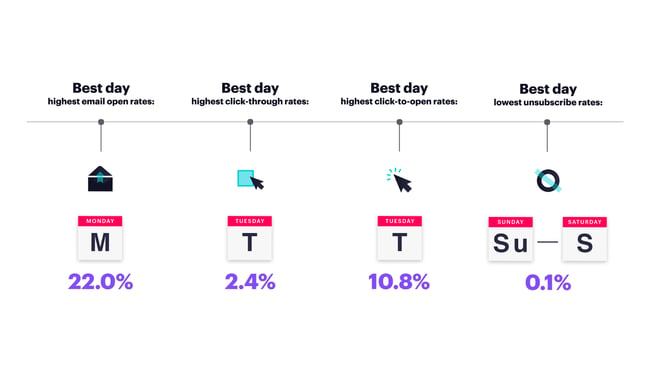
- The best time to send emails is between 9 a.m. to 12 p.m. and 12 p.m. to 3 p.m. (Hubspot Blog Research, 2022)
- Tuesdays have the highest CTRs (2.4%), and Sundays and Saturdays have the lowest (2.1%). (Active Campaign, 2022)
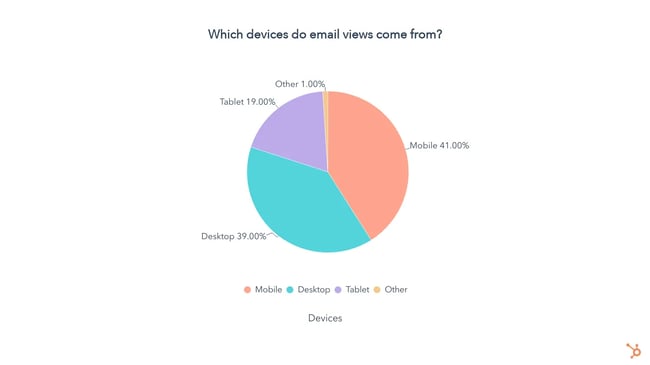
- A majority of email views come from mobile devices (41%), followed by desktops (39%.) (HubSpot Blog Research, 2022)
- Average email open rates increased from 27.91% to 37.65% in 2022. (Mailerlite, 2022)
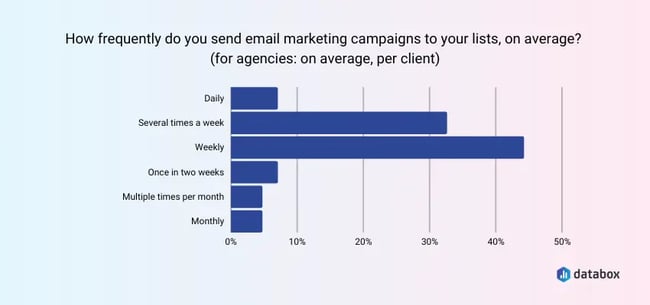
- More than 40% of marketers prefer sending weekly emails. (Databox, 2023)
Check out our ultimate list of email marketing stats for more amazing discoveries.
There you have it: A frame of reference for how your emails should be performing based on your industry. What is the next thing on your to-do list? The steps you'll take to improve your open rate.
Editor's Note: This post was originally published before August 2019 and updated in April 2023 for comprehensiveness.


![23 Sales Email Templates With 60% or Higher Open Rates [+ Bonus Templates]](https://blog.hubspot.com/hubfs/sales-email-templates-2.jpg)


![How & When to Use an AI Email Assistant [+Tools to Consider]](https://blog.hubspot.com/hubfs/ai-email-assistant%20%281%29.png)