Reporting is hard. But it’s not because we don’t have the data or the *right* tools.
It’s that there are too many tools. And they don’t talk to each other. So all the data is in different places.
This makes it hard to answer the million-dollar question: How effective are my digital sales and marketing activities at generating pipeline, creating customer value, and driving revenue?
At Drift, we’re always working hard on updates that make it easier for our customers to understand what’s actually moving the needle, report on the ROI you’re driving, and spend more time doing what you do best – accelerating revenue for your business.
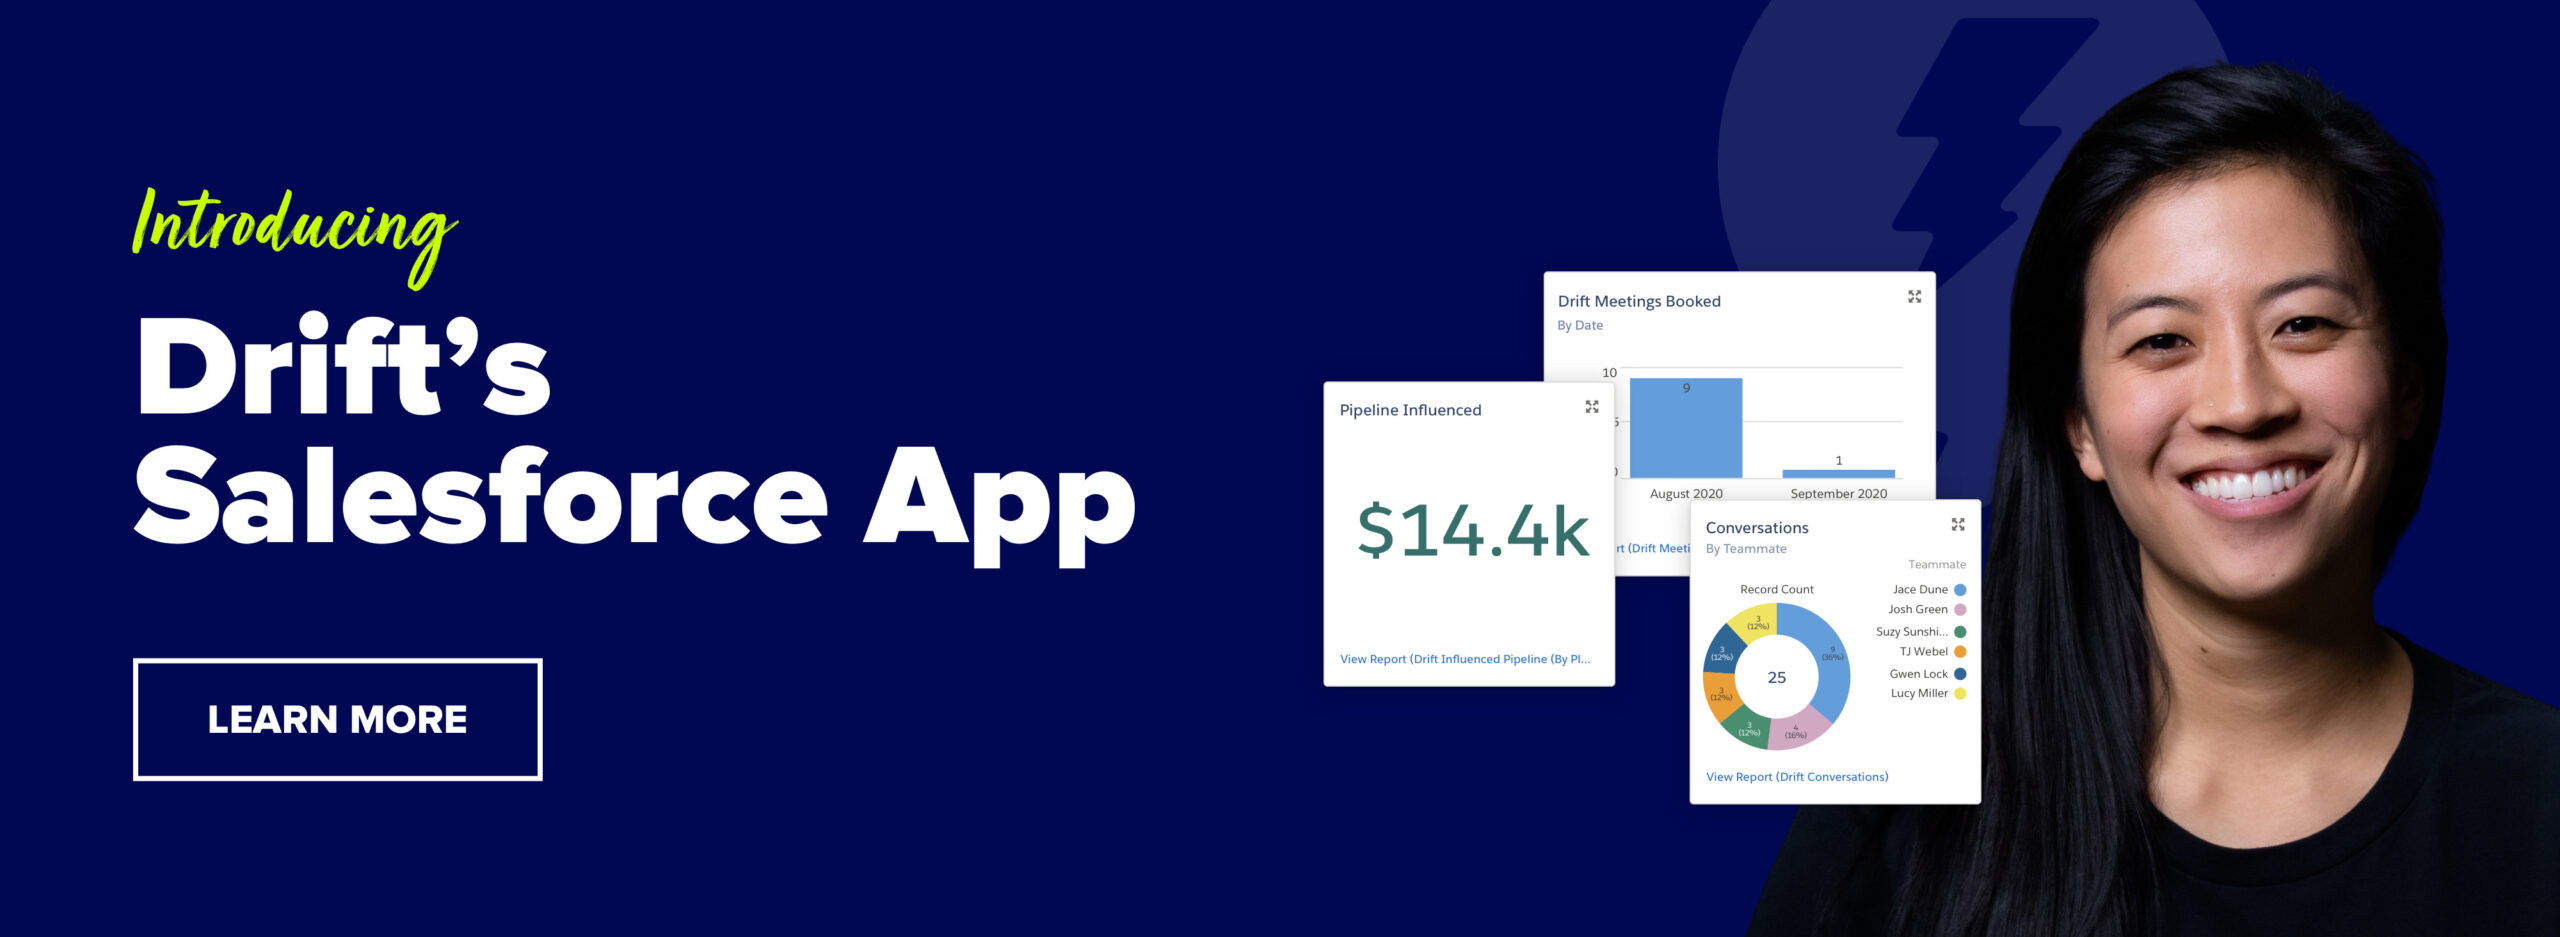
The Drift for Salesforce App features centralized reporting, pre-built dashboards, and a custom Salesforce object to save you time and make life a little easier.
But don’t just take it from us 👇
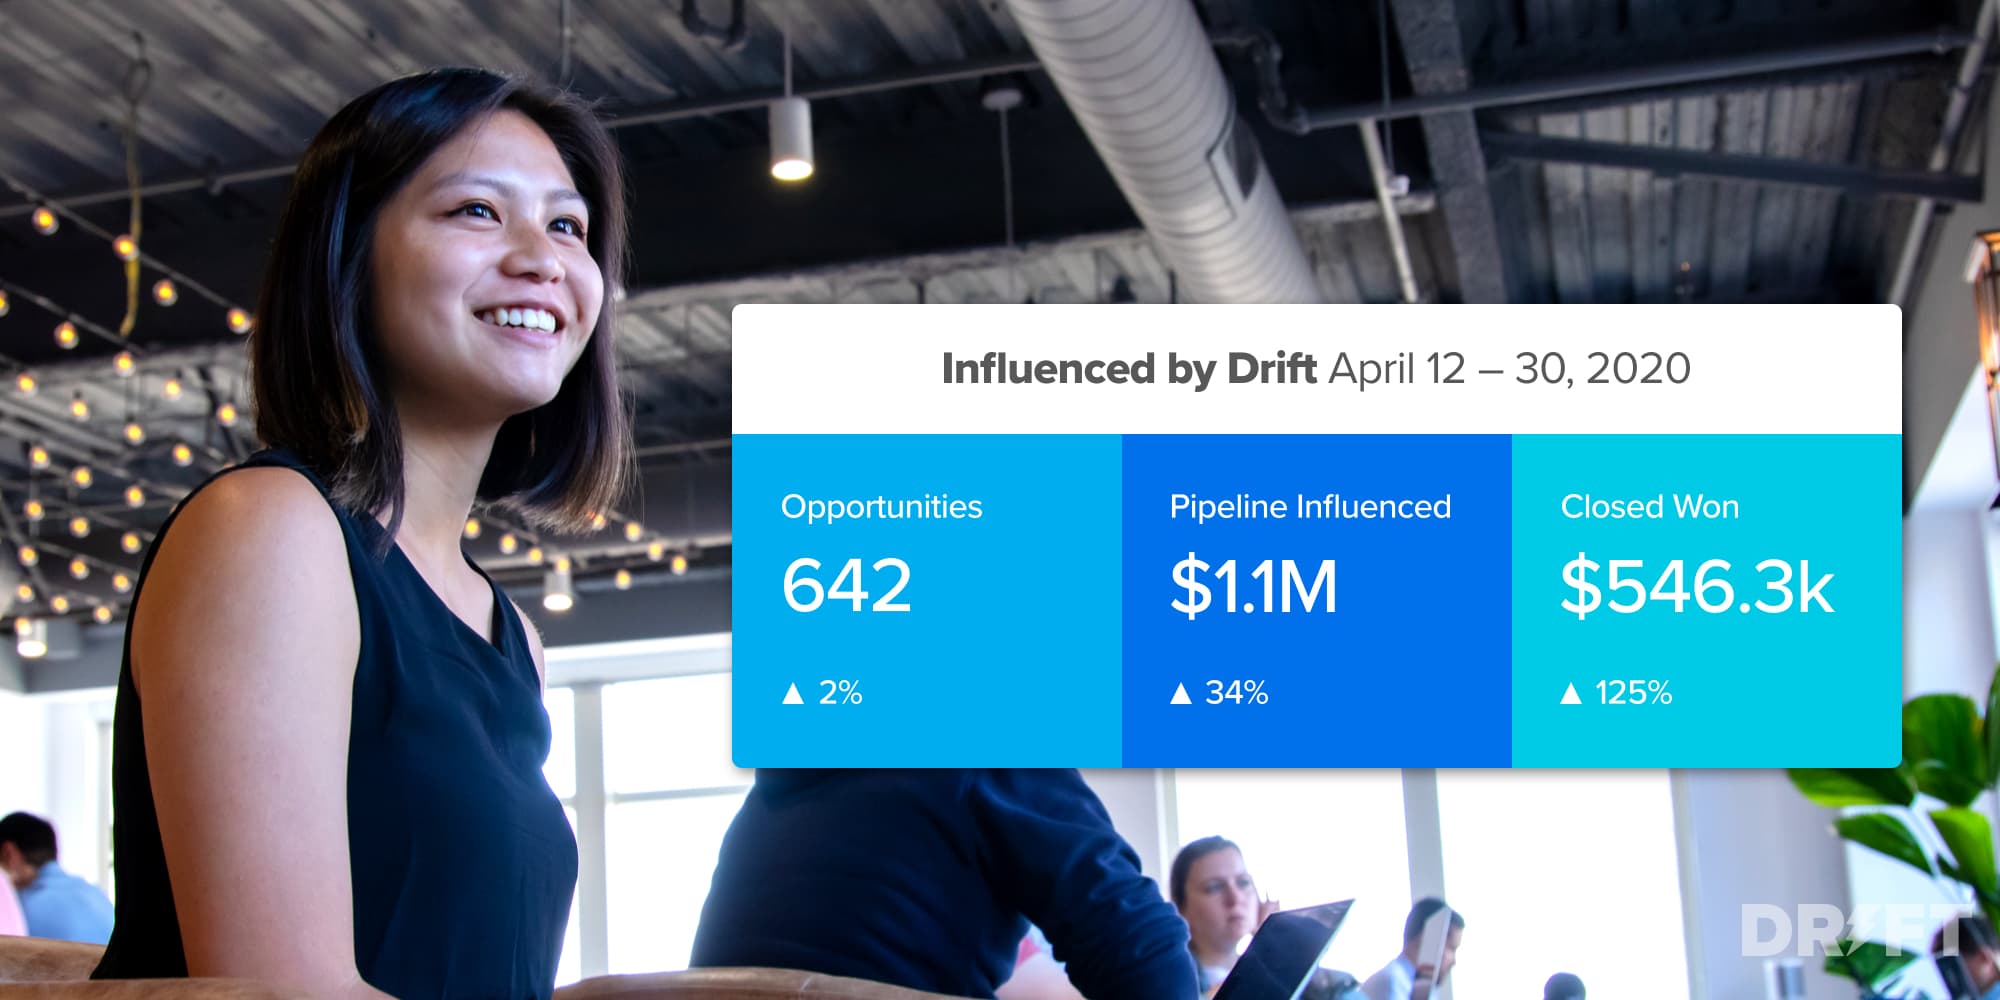
“It’s so much easier to show executives the impact Drift has on our Pipeline and Closed Won revenue now that it’s automatically calculated and available within Salesforce.”
Keep reading to learn more 👀
Manage All Your Reporting Needs in One Place
Conversations with your buyers contain a ton of context. Wouldn’t it be great if those insights could be automatically added to your CRM so you can easily track performance and report on results all within one single platform?
With Drift’s Salesforce App, it’s easy to quickly understand and report on the impact Drift has on your business and share performance insights with colleagues who may not be Drift users.

The best part? Drift’s Salesforce App integrates seamlessly into your existing reporting workflow, so you don’t have to change a thing to see the impact of Drift on your business.
Measure and Demonstrate Impact to Your Key Business Goals
We all get asked the questions – how is XYZ product or messaging performing? How much ARR is it creating? But it’s often hard to find the information we need to answer those questions. And if we do ever find what we’re looking for, it’s after hours of searching.
Drift’s pre-built reports and custom dashboards give you an at-a-glance view of your performance so you always have the information you and your stakeholders need – right at your fingertips.
You can also use the app to analyze your performance across the business, by specific metric, or by teammate so you can easily identify specific areas where you should double-down.

Here’s an example. Let’s say you notice your competitive win rate (CWR) is particularly low across your mid-market sales team. Initially, you’re not sure why, but after reviewing your Drift conversation data, you uncover the root cause: your product is missing a feature that mid-market buyers require to make a purchase 💡
But we also know you might want to play around with the data yourself and dig in a little deeper. So we made it easy for you to add Drift to existing reports – or when you’re creating new ones – using Drift’s custom Salesforce object.

Easily Share Data Across Your Tech Stack
And, last but not least, we know that siloed data isn’t helpful to anyone. So, with Drift’s Salesforce App, we’ve made it possible for you to not only access this data and leverage it across your core tech stack.
Whether it’s your business intelligence or sales productivity tools, you can push Drift data into any of your tech systems that have a Salesforce integration.
This ensures all of your core technologies are up-to-date and you’re not stuck with different data from different platforms – not knowing which one is accurate. With Drift’s Salesforce App, you can be confident in the accuracy of your data and see it all in one place.
Want to get more insights (and drive more revenue)? Get a demo today.
Editor’s Note: This article was originally published in November 2020 and has been updated to reflect new information.