
The 2024 Benchmark Report is our latest dive into metrics and compensation for the AE role within SaaS companies. It summarizes the findings from leaders at more than 170 B2B SaaS companies regarding the current state of the Account Executive role.
You can download the 2024 SaaS AE Report here.
If you'd rather watch the report than read it, Kyle Smith and I recorded a video walkthrough and breakdown.
Here's a peek at what you'll find inside:
SaaS Account Executive Quotas
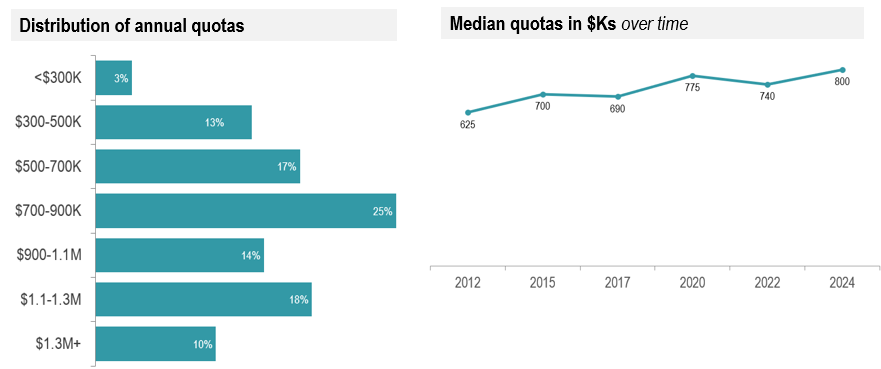
Median annual ACV quota for a SaaS AE rose to $800K (page 32). This is up from $740K in 2022. Taking a step back, we see that quotas have risen modestly, at just a 2% compound annual growth rate, since 2012.
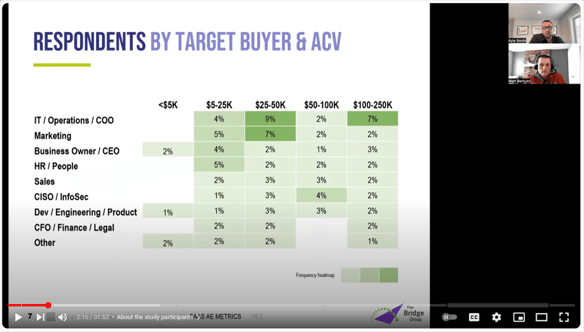
The largest factor in determining quota is ACV (page 33). The difference in quota for a <$25K ACV seller and a $250K+ seller is nearly 2.5X. Compared to 2022, quotas grew across all ACV bands. But larger—double-digit percent—increases were concentrated at higher ACVs.
AE Compensation: base & OTE
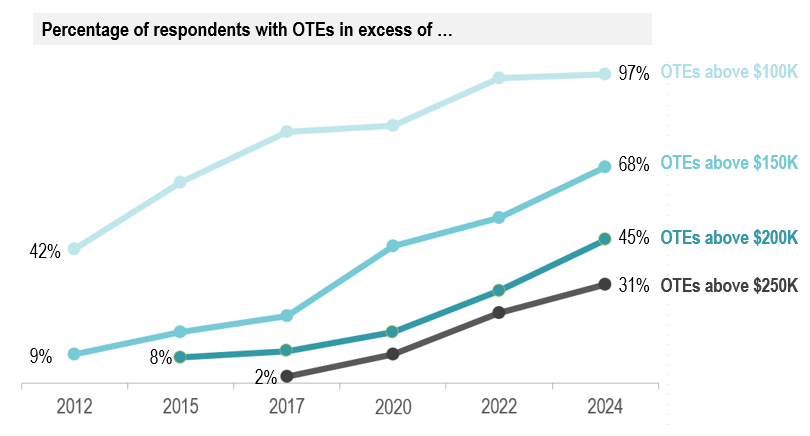
Median annual on-target earnings (OTEs) are $190K with a 53:47 base : variable split (page 39). That is up from $167K in 2022. Continuing a decade-long trend, median OTE rose to record highs in 2024. As discussed above, quotas increased at roughly 2% annually, OTEs have risen at more than 5% compounded annually over that same period. This has resulted in a re-shaping of the Quota:OTE ratio (page 43) and commission rates (page 44).
Check out the 2024 Bridge Group SaaS AE Metrics & Compensation Report to uncover all our findings. We hope these reports help you benchmark against your peers and put trends that you may not have been aware of on your radar.