If you want to stay afloat in today’s cutthroat business world, it’s important to stay one step ahead of the competition. For this, you need to turn sales forecasting into an art form.

This can be challenging for small and new businesses. Entrepreneurs are often optimistic about the future of their businesses. Yet, many are uncertain about the best way to predict their profit margins.
In this article, you’ll learn what sales forecasting is all about and how to do sales forecasting in Excel.

Method 1. Exponential Smoothing
What is sales forecasting?
Sales forecasting is the process of predicting your future sales revenue. It typically involves estimating how much your company will sell within a specific time period. That may be the next week, month, quarter, or year.
There are several sales forecasting methods you can use depending on your sales structure and processes. If you’re an established business, you will likely find it easier to create accurate forecasts based on your past sales data.
Newly founded companies, however, will have to rely on other methods, such as market research or competitive analysis, to predict their future sales. Competitive analysis involves assessing your competitors' strengths and weaknesses, particularly the market's major players.
A sales forecast is instrumental in helping you plan ahead. It effectively provides a snapshot of your company’s projected sales, which lets you make informed business decisions. It also allows you greater efficiency in managing many key internal functions, such as the organization of your resources, cash flow, and workforce.
Not to mention, with your sales forecast in hand, you can better respond to many emerging challenges and keep up with the rapid pace of today’s market.
Sales Forecasting in Excel
Several tools are available to help you make educated sales forecasts. However, Microsoft Excel is by far one of the easiest to learn.
You can use Excel's versatile functions to create sales forecasts, whether you’re an analyst, an executive, a manager, or an investor. You don't need to know how to program or do statistics to use Excel's forecasting function. Retail and online businesses widely use Excel’s forecasting function, which simplifies complex and repetitive data analyses.
The “conditional formatting” option lets you highlight specific values or change the appearance of cells that meet specific criteria. This helps highlight certain trends and patterns within the data, simplifying the overall process. Using Excel, you can also create visually appealing charts and graphs that help make the overall forecasting process easier.
Another benefit of using Excel is the flexibility you get when performing tasks like formatting worksheets, entering formulas, and creating forecasting schedules. Excel spreadsheets let you customize your forecasts according to your specific set of requirements.
Better yet, Excel has an impressive set of tools such as Anova, exponential smoothing, and moving averages, as well as several relevant functions like Linest, Correl, Forecast, and Trend. All of these features can be used in sales forecasting. You just need to invest time to understand how to apply these tools, and you’ll be ready to go.
The next part of the article details how to do sales forecasting in Excel.
Sales teams and accounting and finance departments use many different methods to build sales forecasts in Excel. However, two quantitative forecasting methods are the most common: 1) exponential smoothing and 2) moving averages. Let’s dive into each.
Method 1. Exponential Smoothing
Exponential smoothing is a form of time series forecasting. This method smooths out irregularities in your data by assigning exponentially decreasing weights to older observations.
Put simply, newer data sets are deemed more relevant and given greater weight. This “smoothing” function allows for more accurate sales predictions.
Given the quality and quantity of your historical data, exponential smoothing lets you make sales forecasts well into the next year. It is thus useful for longer-term sales forecasts.
Below is a step-by-step guide to Excel’s exponential smoothing function.
Step 1
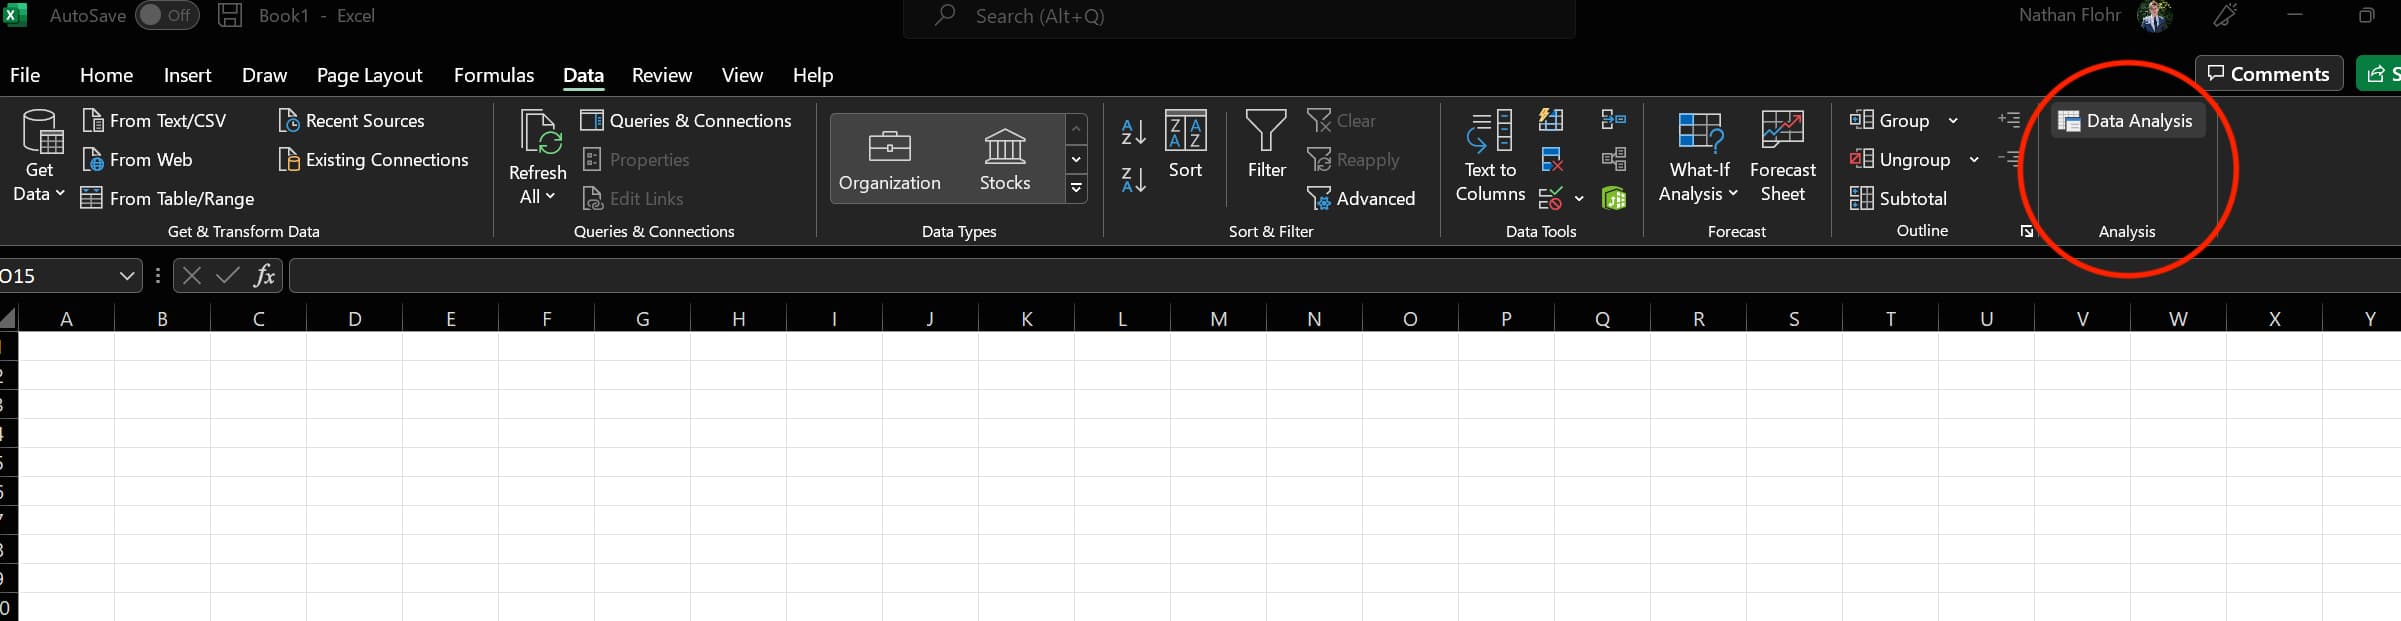
Click on the Data tab menu. You will see various options to analyze, manipulate, or visualize data.
-jpg-1.jpeg)
Step 2
In the Analysis group, click on Data Analysis.
Step 3 (Optional)
Can’t find the Data Analysis tab? You will need the add-in Analysis ToolPak and load it. This feature isn’t automatically loaded in Excel; you need to do it manually.
Follow these easy steps to add Analysis ToolPak:
1. Select File from the top bar.
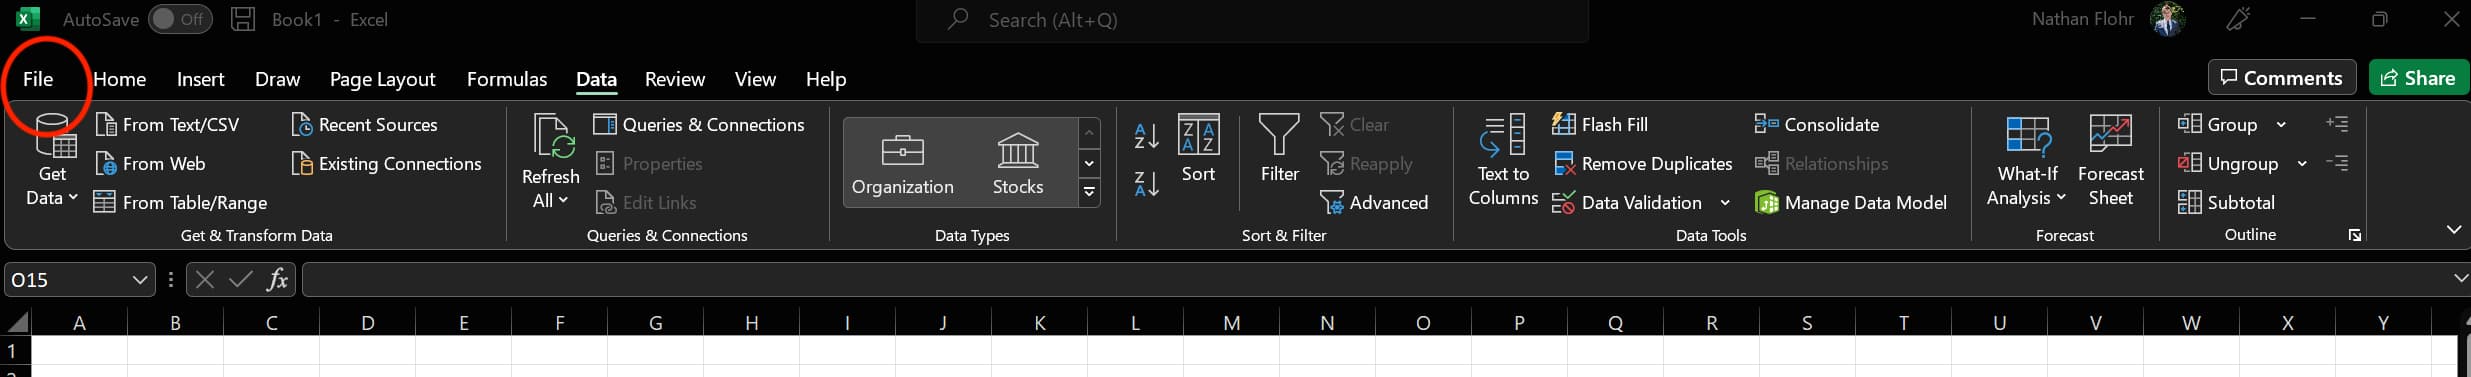
2. Click on Options from the menu on the left.
-jpg.jpeg)
3. A new dialogue box for Excel Options will appear on your screen. Click on Add-ins.
-jpg.jpeg)
4. A new list of options will appear before you. In the Manage section, select Excel Add-ins and then click on Go.
-jpg.jpeg)
5. This opens a new Add-Ins dialog box.
-jpg.jpeg)
6. Tick the checkbox for Analysis ToolPak and click OK.
-jpg.jpeg)
After the above is complete, you will see the Data Analysis section in the Data menu.
Step 4
Under the Data Analysis menu, select Exponential Smoothing and click OK.
-jpg.jpeg)
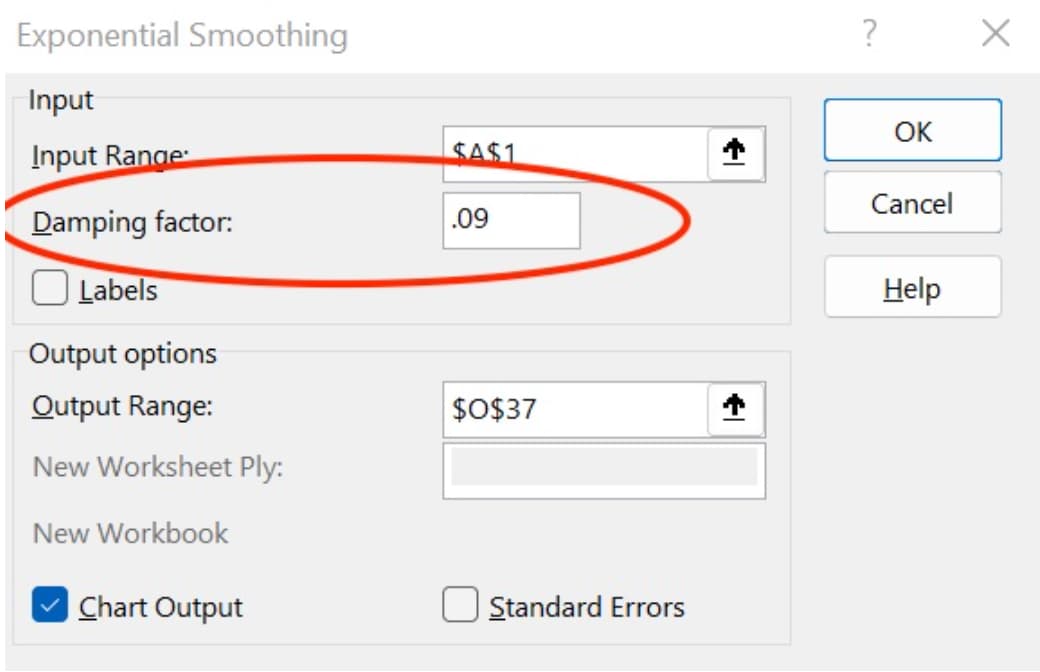
Step 5
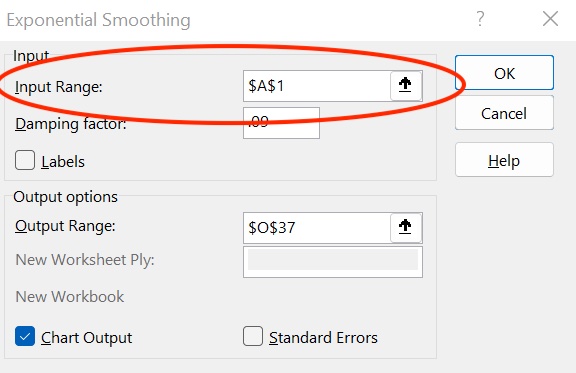
A dialogue box for Exponential Smoothing pops up. Click on Input Range and enter the data range you want to analyze.
Step 6
Take α (alpha) as the smoothing constant and type “0.9” in the Damping Factor blank. The value 0.9 is equal to 1- α.
-jpg.jpeg)
Step 7
In the Output Range blank, select the cell number where you’d like the results displayed.
%20(1)-jpg.jpeg)
Step 8
If you want Excel to display your results visually, tick the Chart Output option at the bottom and click OK.
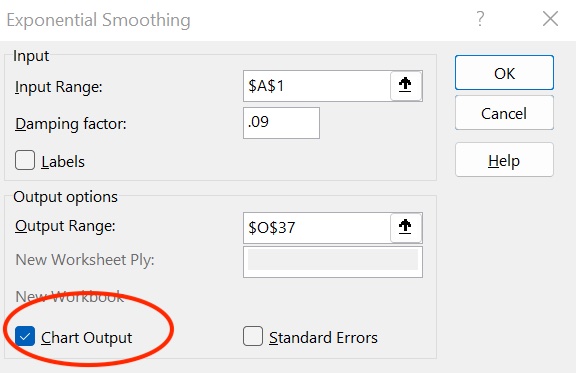
And there you have it. The damping values will appear in the selected column.
This is easily one of Excel's most straightforward sales forecasting methods.
Method 2. Moving Average
The moving average is a statistical method that helps businesses forecast long-term trends. It works by calculating the average of a set of values for a given time range. It’s called “moving” because a new value is calculated for an upcoming time period.
The advantage of using the moving average technique is that it can be calculated for any period of time. It is a simple method that can apply to a wide range of data sets. The moving average method is also very flexible and allows
Here’s a step-by-step breakdown of how to do sales forecasting in Excel using the moving average method.
Step 1
First, click on Excel’s Data tab. A range of different options will appear on your screen.
%20(1)-jpg.jpeg)
Step 2
In the Analysis section, select Data Analysis. This action opens a window with a list of analysis functions you can perform.
-jpg.jpeg)
NOTE: If you can’t find the Data Analysis option, you will first need to load the Analysis ToolPak add-in (refer to instructions given in Step 3 above).
Step 3
From this list, select Moving Average and click OK. A new window for Moving Average will pop up.
-jpg.jpeg)
Step 4
In the Input Range box, enter the data range you want to analyze.
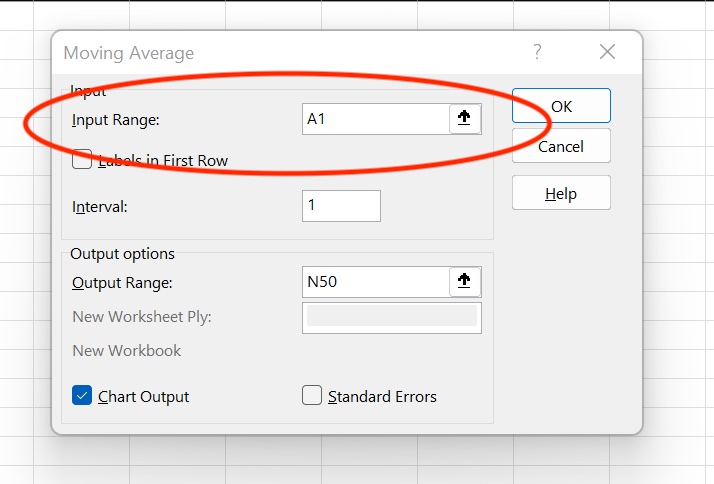
Step 5
Input your preferred interval into the Interval box.
Step 6
In the Output Range box, enter the cell where you want the moving averages to be listed.
%20(1)-jpg.jpeg)
Step 7
For a visual display of the results, tick the Chart Output option and click OK.
-jpg.jpeg)
The moving averages of your data should now appear in the selected column.
This is yet another uncomplicated method of calculating sales forecasts.
Customizable Forecasting is the Future
Microsoft Excel is an incredibly useful and flexible tool to track data sets. You can also draw on historical data to compute sales values for the future. Using Microsoft Excel in sales forecasting lets you visualize your data in various ways. However, there are several customizable sales forecasting software options available.
The forecast tool in HubSpot, in particular, is one easy-to-use customizable forecasting option. You’ll be able to edit the forecasting fields according to your needs. This approach allows businesses to input data on various factors and generate a more accurate forecast.
In addition, HubSpot provides the flexibility to adjust the forecast as new information arises. Try HubSpot’s forecasting tool today to see a detailed picture of your monthly and quarterly revenue.


![12 Tactics for Better Sales Forecasting [+5 Forecasting Models to Leverage]](https://blog.hubspot.com/hubfs/sales-forecasting-model_2.webp)