You’ve probably turned on CNBC long enough to hear about big companies hitting or missing their “sales forecasts,” and you’ve probably seen company stocks going up or down based on how analytics compare historical sales data to those forecasts.
But while business forecasting and quantitative analysis is definitely a hot topic for big companies and their sales managers, it’s a foreign concept for most solopreneurs and small businesses.
These organizations often suffer from a “feast or famine” lifecycle and have major difficulties creating accurate sales forecasts — if they create them at all.
But it doesn’t have to be that way.
In this article, you’ll get a crash course in business forecasting as well as sales forecasting methods that you can use right now to create a more accurate model for your business.
Ready? Let’s go.
What is a sales forecast?
Simply put, a sales forecast is an indication of your expected sales revenue over a given period of time, like a week, quarter, or year.
The best business forecasting methods use historical data sets, market research, anticipated future trends, and other factors to create predictions with a fairly high degree of accuracy.
From the standpoint of metrics and analysis, if you have a strong set of past data and a historical record of performance, then you can use it to predict future growth.
Of course, sales forecasts can also be woefully incorrect.
Economic conditions, new product launches, poor decision-making or business management, and unforeseen future events can all create deviations in the predictive models and lead to woefully inaccurate projections.
For a great example of that, consider the COVID-19 pandemic in 2020.
Any accurate forecast based on historical data points at the start of 2020 would have been completely inaccurate as sales plummeted and the pandemic took hold by the middle of the year.
It was so bad that publications like Forbes and HBR were running articles to help readers understand how to handle this in the wake of a full economic meltdown.
While big companies have ways to include fluctuations like this in their predictive models, small businesses won’t need to worry so much about that at this stage.
Even with minor variances, a decent sales forecast can be a powerful business tool to help you ensure that your sales team is on the right track.
So it’s vital to know about the various sales forecast methods you could use, plus how to get the most out of them.
Why do I need it?
Sales forecasts are an important planning tool that you can use to take ownership of business operations that might feel like they’re outside of your ability to control.
Short-term forecasting can help you better understand your sales and proposal process and nail down your ability to set effective revenue goals for your business.
Long-term forecasts can help you understand business growth over time and teach you how to use past performance data to optimize your business workflow.
With a great sales forecast, you’ll be able to look six months to a year down the road, see the growth that’s possible, and figure out how to actually get there.
While this article focuses specifically on sales forecasting models and will provide some of the nuts and bolts to help you get started, it’s worth pointing out that there are several forecasting models that you can use to create reliable outcomes.
If you’re doing research, you’re likely to run into a few of these models.
A brief description of each is outlined below.
Types of business forecasting techniques
1. Time-series models
If you’re planning to use historical data as the lynchpin to any forecasting model, you’re probably looking at a time-series model.
With this method, you’ll use past data as a predictor of future sales performance and growth.
Just a side note: If you’re a PandaDoc user, you can access up to a year of historical data directly from your dashboard.
This method is great for businesses in which the price of goods remains largely stable, and growth is often determined by scaling that the business can largely control.
For example, if you run a cleaning service and your overhead costs (supplies, labor, etc.) have been largely consistent for the past several years, then your ability to grow may be largely dependent on simply scaling your operation and aggressively trying to grow new accounts.
In a scenario like this, growth comes down to the business strategies you implement, so time-series data and an appropriate growth methodology probably make sense.
2. Indicator approach and econometric models
This method of forecasting looks at supply, demand, and price fluctuations to try and discern indications of growth.
These models are most often used in academia, research, and governmental policy discussions rather than sales.
Using this model, you’ll need to assess the economic relationship between multiple variables, try to determine the link between those variables, and see how they might impact future business opportunities.
Econometric models are the most technical because they rely on statistical models and broad datasets to determine buyer appetite and causal indications that signal a surge in consumer demand.
If you’re a small business without access to economists, artificial intelligence platforms, and decent number-crunching tools, this method may not be for you.
3. Judgmental forecasting model
The most subjective model available, judgmental forecasting steps back from quantitative methods of sales forecasting and instead relies on intuitive forecasting to make appropriate predictions.
If you’re a numbers-driven individual, taking this approach might seem somewhat beyond the pale, but judgmental forecasting is a great fit when a lack of information means that quantitative forecasting isn’t an option.
While all forecasting methods are truly just educated guesses, judgmental forecasting relies on the expertise and intuition of the forecaster to make the right decision.
If you haven’t been tracking the metrics required to create an accurate forecast, or if a major sea change in your industry renders your current data sets invalid, you may be left to take an educated guess and pick a direction.
Gathering new data and using it as a reference point can increase the accuracy of judgmental forecasting, but this methodology is typically overtaken quickly by quantitative models once enough sales data is available.
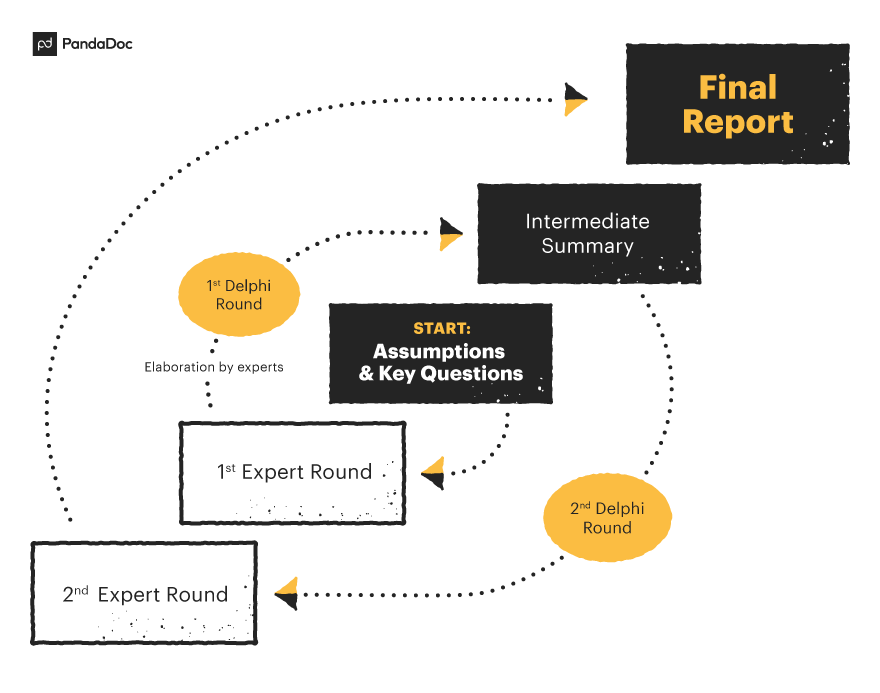
4. The Delphi method
Named after the high priestess of the Temple of Apollo, known as the Oracle of Delphi, this method of forecasting relies on predictions made by a panel of experts.
The assumption being made through this qualitative method of forecasting is that these experts can leverage their industry expertise to predict with a greater level of accuracy how a market will change.
Often, these experts will fill out a questionnaire or answer a series of questions put forth by the company in order to arrive at the best course of action for the organization.
What are the statistical methods of sales forecasting for time-series models?
In this section, we’re going to dive into the methods of sales forecasting for time-series models one by one, and give you the lowdown on what they are and why you might use them.
1. Simple moving average (SMA)
Simple moving average (SMA) is the average of the past n data points, and it predicts future sales.
The number n is referred to as the window size.
The resulting value that’s obtained by calculating the simple moving average is the forecast for the next period.
Why use SMA?
SMA is a good choice for sales forecasting when the data is relatively stable and doesn’t have any major fluctuations or outliers.
It’s also a good method to use when you want to get a quick, high-level overview of data and trends. SMA is also simple to implement and can be done in just a few lines of code.
2. Exponential smoothing (SES)
Exponential smoothing is a statistical method that involves using a weighted average of past data points to produce a forecast.
This method takes into account both the previous data points and the current value to produce a forecast.
The weights decrease exponentially as the data gets older, hence the name exponential smoothing.
Why use SES?
SES is a good method to use when you want to take into account the recent values and trends of data.
It’s also a good method to use when you want to smooth out the fluctuations in the data, making the forecast more stable and reliable.
3. Autoregressive integrated moving average (ARIMA)
Autoregressive integrated moving average (ARIMA) is a statistical method that involves using a combination of autoregression, differencing, and moving average techniques to produce a forecast.
Autoregression is the use of past data points to produce a forecast, differencing is used to remove trends and seasonality in the data, and moving average is used to produce a weighted average of the past data points.
Why use ARIMA?
ARIMA is a good method to use when you have time series data that has a clear trend and seasonality. ARIMA takes into account the trend and seasonality of the data, which makes it a good choice when you want to produce a more accurate forecast.
4. Neural network (NN)
Another method is to use artificial neural networks to produce a forecast.
Neural networks are computer algorithms that are designed to mimic the structure and function of the human brain.
They’re used to recognize patterns and relationships in the data and make predictions based on these patterns.
Why use NN?
NN is a good method to use when you have a large amount of data and you want to produce a highly accurate forecast. Neural networks are good at recognizing patterns and relationships in the data that may be difficult for humans to detect, which makes them a good choice for sales forecasting.
5. Croston
Croston is a statistical method for sales forecasting that’s specifically designed for intermittent demand time-series data.
Why use Croston?
Croston is a good method to use when you have time-series data that’s characterized by long periods of zero or low values and short periods of high values.
Which forecasting method should I use?
The most suitable forecasting method for you will depend on the data and resources that you have available for your business.
If you’ve been tracking metrics that you’d like to change, it’s easy to do a time-series analysis, make a policy change in line with your objective, and monitor the moving average over time.
If you lack sufficient data, you may have no choice but to adopt a judgmental forecasting model, make your best guess, and start tracking the metrics and data points that make the most sense to help you make an informed decision.
Some of these metrics might be obvious.
PandaDoc reporting tools can help you track everything from the number of sales documents that your sales reps close and the amount of revenue earned from each document to exactly how documents and deals move through your sales pipeline.
But, while sales activity is one aspect to monitor, you’ll still need to consult other tools to best determine where you might close other opportunity gaps in order to maximize profits.
Other business forecasting tools to consider
1. Predictive analytics
Predictive analytics tools use complex algorithms and machine learning techniques to analyze your sales data and make predictions about future sales trends.
This type of tool can help you identify key drivers of sales and quickly adapt to changing market conditions, which makes them powerful sales strategy indicators.
2. CRM systems
Sales forecasting customer relationship management (CRM) systems use your pipeline of potential deals to predict future sales growth.
By using CRMs to track customer interactions, sales patterns, and behaviors, you will be able to gain valuable insights into your customers’ preferences and make more accurate sales forecasts.
3. Market research tools
Want to stay ahead of the curve when it comes to market trends?
Market research tools provide valuable insights into customer preferences and market trends, allowing you to make informed predictions about future sales.
With this information, you can be proactive instead of reactive and make data-driven decisions that help drive your sales forward.
Getting started with sales and quantitative forecasting
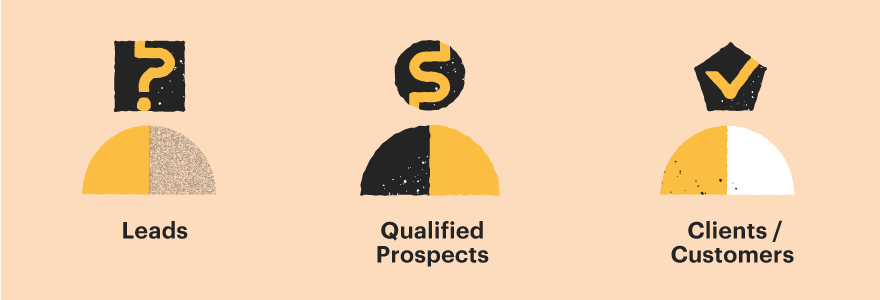
Before you get into forecasting sales, you have to understand how you obtain the basic elements of a sale.
Here’s a very simple look at those basics:
- Leads. These are people who go from being unaware of your business to being a trackable lead (e.g., they subscribe to your mailing list, you reach out to them directly, or you advertise). There are several ways to obtain leads, but, once you have them, you’ll need to convert them.
- Qualified prospects. All your leads won’t become customers. There has to be some process to qualify which leads are ready to hear your pitch and potentially become buyers.
- Clients/customers. Out of those prospects, you’ll have a percentage (should be a decent one) that will “close.” This means they’ll sign a deal, buy your products, etc.
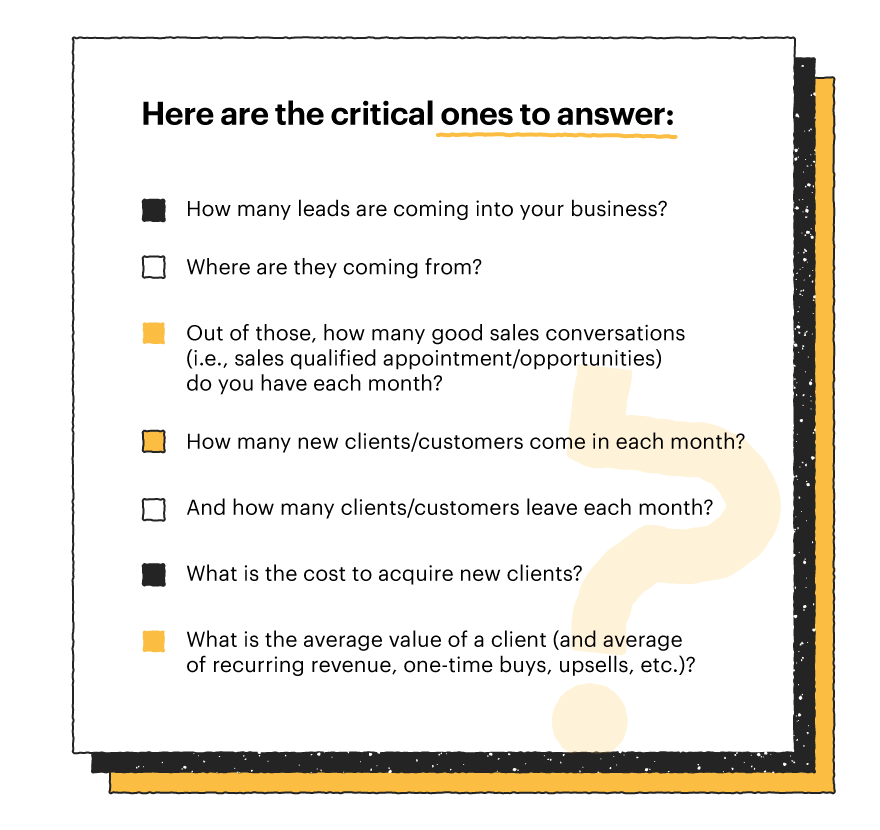
Knowing your numbers
You have to trace down where the money is coming from.
This might sound like a cop drama, but if you can follow the money, you can solve most cash flow problems in your business.
You find your numbers by asking yourself questions and getting the facts.
If you’re trying to answer these questions and can’t—don’t worry.
You may have to make judgment calls based on what you’re seeing and conduct a trend analysis over time as you begin to compile that data.
Set your target (dates and dollars)
“Begin with the end in mind” seems to be a term coined in the book The 7 Habits of Highly Effective People.
Regardless of where it came from, it’s a very effective starting point for forecasting the future sales of your business. After you find out your current numbers, you’ll have a realistic view of how quickly you can grow your business.
For instance, if you’re making $8,000 a month on average,; it may be possible to increase that to $12,000-$16,000 per month within the next 12 months. But $100k per month in the same time period would be a stretch.
Make sense? Set a goal that you think can be achieved, and then run it through a few tests.

Those questions might include:
1. How can I increase my leads?
Increasing your sales by 50% is likely going to take at least 50% more leads.
This means that you have to take your current lead generation and see if you can increase it.
Sometimes, this can be done by leveraging sales automation tools in order to free up resources for lead sourcing.
Other times, it may require additional spending in your marketing and ad budgets.
If you’re using Facebook or LinkedIn ads, can you double the ad spend and keep the click-through rate?
If you don’t think your current method will yield the number of leads needed to reach your goal, you’ll have to add other methods.
Could you add cold email outreach to your inbound strategy? Or can you simply ask for referrals and get some more clients (if you sell something like high-dollar consulting services)?
2. What infrastructure will this increase take?
More sales mean more clients.
And more clients mean more deliverables. More leads mean more conversations.
Of course, all of this takes place in the same 24/7/365, and you’ll have to solve problems surrounding increased efficiency and higher overhead.
This is a crucial problem to consider because, even if you can accurately forecast your sales for the next year or half a year, if you can’t service the business coming in, your forecast might outlive your company!
Boosting efficiency
Increasing efficiency is a matter of shortening the pre-sale and post-sale processes.
This might mean doing calls to ensure that each new client is aware of how things are going to go.
You could also streamline paperwork by using templates and services that improve the velocity at which deals and contracts (invoicing, proposals, agreements, standard procedures, etc.) are signed.
Polish up your processes before you try to increase your leads. That way, your system, and your team are better able to accommodate this new operational change.
Handling overhead
Increasing overhead is a matter of figuring out whether or not the current staff can handle the business you predicted with your forecast goal.
If not, hiring new workers or contractors may be necessary.
Figure out the staffing/freelancing/contracting power you’ll need before you start sending out twice the number of proposals.
Finally, fill in the blanks
You have where you are and where you want to go. It’s like an algebra equation. You’ve got to fill in the blanks to finish the DNA of your increased revenue.
If you understand your situation and sales goals well enough, this should be the exhilarating part.
It’s best if we explain this with an example. Let’s get into the thick of the numbers.
Company: A small digital marketing agency specializing in web design and SEO.
Current revenue: $20,000-$22,000/mo
Revenue target: $40,000/mo
Goal timeframe: Six months
Other essentials
Number of clients: Average of three new web design clients/mo and ten recurring SEO clients
Average income/client: $4,000 avg web design client. $1000/mo avg SEO recurring client
Details: On average, 50% of new web design clients convert to being SEO clients. The average SEO client lasts six months before canceling service. The objective is to find new web design clients and funnel those clients into SEO clients.
Obviously, there are a ton of ways that you can increase sales here.
Let’s go over the most likely forecast.
Example forecast
If you double the number of websites to six ($24,000/mo) and close three new SEO clients at $1000 each, then BAM!
Even with clients leaving after six months, within a year, you’re close to that $40,000/mo target.
And you can start achieving this in the very next month.
Let’s show our calculations in detail.
Month One
$24,000/mo in web design revenue
$3,000/mo in new SEO revenue
$8,000/mo in current SEO revenue (assuming the average of two2 canceling services each month).
Total: $35,000
Month Two
$24,000/mo in web design revenue
$3,000/mo in new SEO revenue
$9,000/mo in current SEO revenue (assuming the average of two2 canceling services each month).
Total: $36,000
Month Three
$24,000/mo in web design revenue
$3,000/mo in new SEO revenue
$10,000/mo in current SEO revenue (assuming the average of two canceling services each month).
Total: $37,000
You get the idea?
Fast forward to month six, and you’ve got $40,000/mo. All by moving through the forecasting process and doubling the amount of web design clients over a reasonable period of time.
Of course, this growth will take work. But, as you can see, it’s possible, and no complex formulas or Excel spreadsheets are required.
If you know your ideal customer, you’ll know how to sell. Everyone knows that in the modern world of sales.
But what’s lesser known is that, if you know enough about your current customers and what you want to achieve in your business, you can leverage your existing success in order to create new growth.
You just need to know your numbers and your goals.
Set better business goals with sales forecasting methods
Sales forecasting is crucial to the success of any small business.
By using the right statistical methods, tools, and sales forecasting techniques, you can gain valuable insights into your sales trends and make informed decisions about your future sales.
Whether you use a sales automation tool, a predictive analytics tool, or a more traditional approach, you must find a solution that works for you and helps you reach your business goals.
With the right sales forecasting method in place, you can be confident you’re making data-driven decisions that help drive your sales forward and set you up for long-term success.
Frequently asked questions about sales forecasting methods
-
Forecasting tools are software applications and techniques that are used to predict future sales trends based on past sales data.
These tools can range from basic spreadsheets that make predictions based on data that’s been manually entered to complex algorithms and advanced sales forecasting software that uses real-time data.
-
There’s no one-size-fits-all answer to this question.
The best forecasting tool for your small business will depend on your specific needs, the type of data that you’re working with, and the level of forecasting accuracy you require. Some popular options include predictive analytics tools, CRM systems, and market research tools.
-
Forecasting sales in Excel is pretty straightforward. You create a simple spreadsheet that lists your sales data over time and then use Excel’s built-in forecasting functions to make predictions.
If you’re looking for more advanced capabilities, you can also use third-party add-ons that offer more sophisticated forecasting tools and algorithms.
Originally published October 9, 2017, updated February 16, 2023
Disclaimer
Parties other than PandaDoc may provide products, services, recommendations, or views on PandaDoc’s site (“Third Party Materials”). PandaDoc is not responsible for examining or evaluating such Third Party Materials, and does not provide any warranties relating to the Third Party Materials. Links to such Third Party Materials are for your convenience and does not constitute an endorsement of such Third Party Materials.