How to connect sales training to pipeline with CRM Scorecards

Hey enablement pros. Buns feeling a bit warm lately?
Recent corporate belt tightening has put sales-adjacent departments like sales enablement and marketing in the hot seat. Because even though they contribute to and quite literally enable sales, their activities aren’t always as easy to tie to the deal as it is for reps who get phone and face time with buyers.
The easiest way for enablement teams to prove their value to executive leadership is by connecting sales training to pipeline. It shows the direct result of your sales training efforts is more money in the door in the form of more pipeline, opportunities, and closed deals — and all you have to do is plug your CRM into Scorecards and let the data do the work for you.
With that goal in mind, let’s look at how sales enablement teams can connect sales training to pipeline using CRM Scorecards.
What’s a CRM Scorecard?
CRM Scorecards show whether training is working, meaning, helping reps improve their skills in a way that helps them close more deals — all thanks to the support enablement provides.
They track learning activities alongside sales key performance indicators (KPIs) such as opportunities and pipeline generated by pulling in Salesforce performance metrics.
Salesforce objects brought into Scorecards:
- Users
- User Roles
- Profiles
- Opportunities
- Task/Activity
Sales KPIs generated as metrics in Scorecards:
- Opportunities Created
- Pipeline Created
- Opportunities Won
- Bookings
- ASP (Average Sales Price)
- Close Rate
- Sales Cycle (days)
Most importantly for our concerns here, Scorecards allow quick visualization of the impact and return on investment (ROI) of training programs without the need to compile data from multiple spreadsheets and reports. That means that when execs come asking for reports on the ROI of enablement roles, you always have the hard numbers handy in a matter of seconds.
You can configure Scorecards to set up different views and dashboards depending on the metrics and correlations you want to monitor. In this case, we want to look at how training and coaching courses created by enablement connect to pipeline, opportunities, and close rates.
You can take a quick look at Scorecards here:
CRM Scorecard insights that connect sales training to pipeline
Course and coaching scores vs opportunities won
One Scorecards view you’ll need to connect sales training to pipeline is course and coaching scores vs opportunities won (shown below).
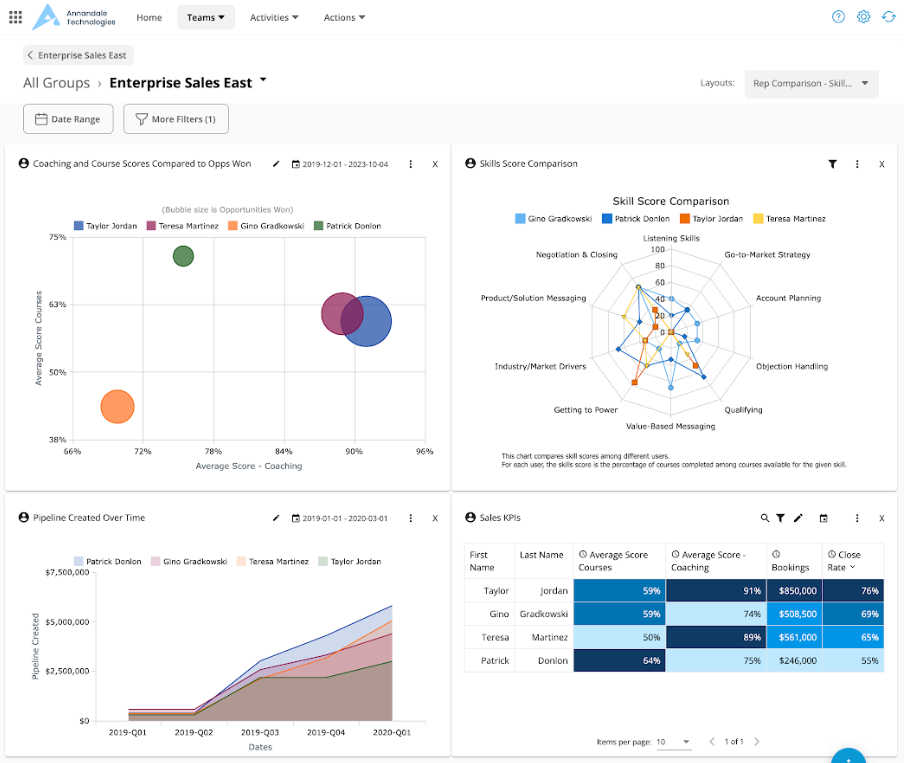
This view directly positions course and coaching scores next to opportunities won to show the connection between learning adoption, scores, and sales success.
As an enablement practitioner, visualizing the data this way also lets you assess the success of sales reps in the field and diagnose skill areas where they may need assistance so you can continually improve upon your programs (and raise that ROI number).
For example, the bottom right panel in the dashboard lets you see that high coaching scores correlate to higher close rates and revenue.
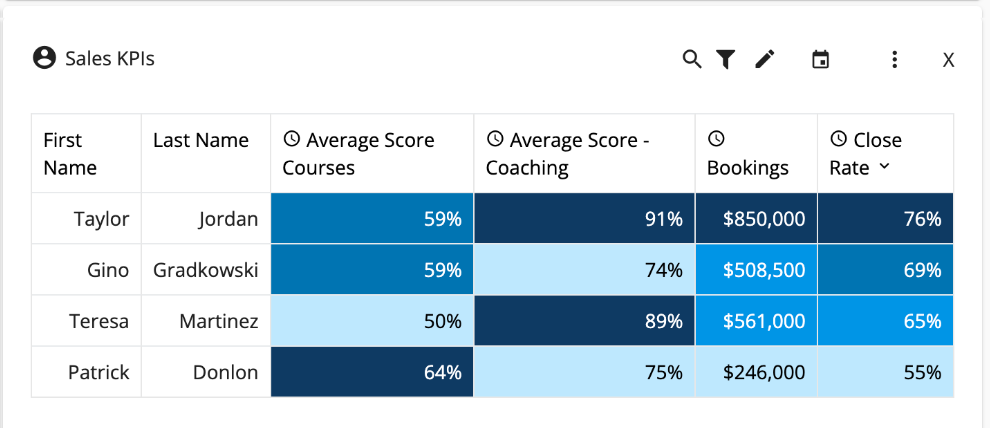
Just using the two right-hand panels in this view also tells you:
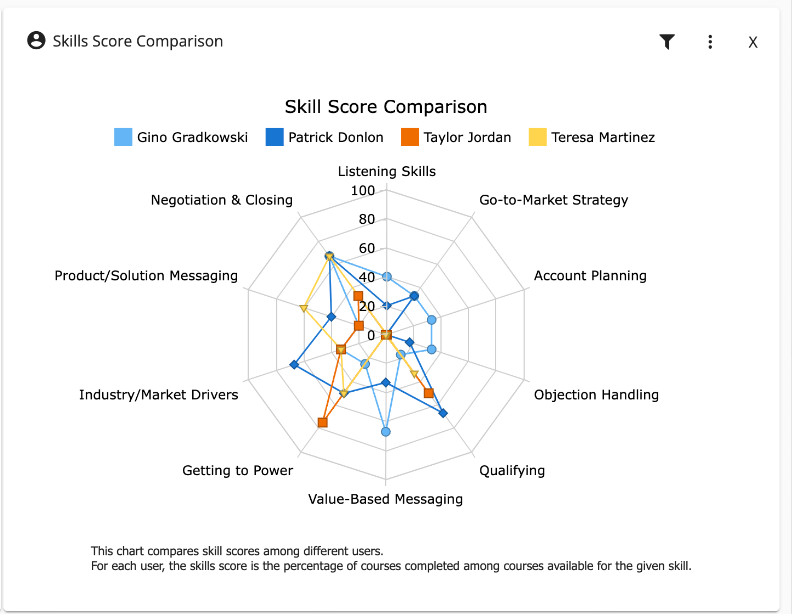
- You need to enforce adoption of coaching challenges focused on objection handling, listening skills, and account planning.
- Coaching might be more effective than courses in increasing close rates.
- Reps who score high in both courses and coaching challenges are the most successful.
- Reps who focus too much on either coaching or courses tend not to have the highest bookings or close rates.
For more on skill development techniques, check out: What vibes help you sell? How AI-powered sales coaching improves your pitch
Rep to team comparisons for completed enrollments and close rates
If pipeline metrics are falling below where they should be (which you can set up alerts for), Scorecards also help you find the root cause of the problem by comparing individual reps to team performance.
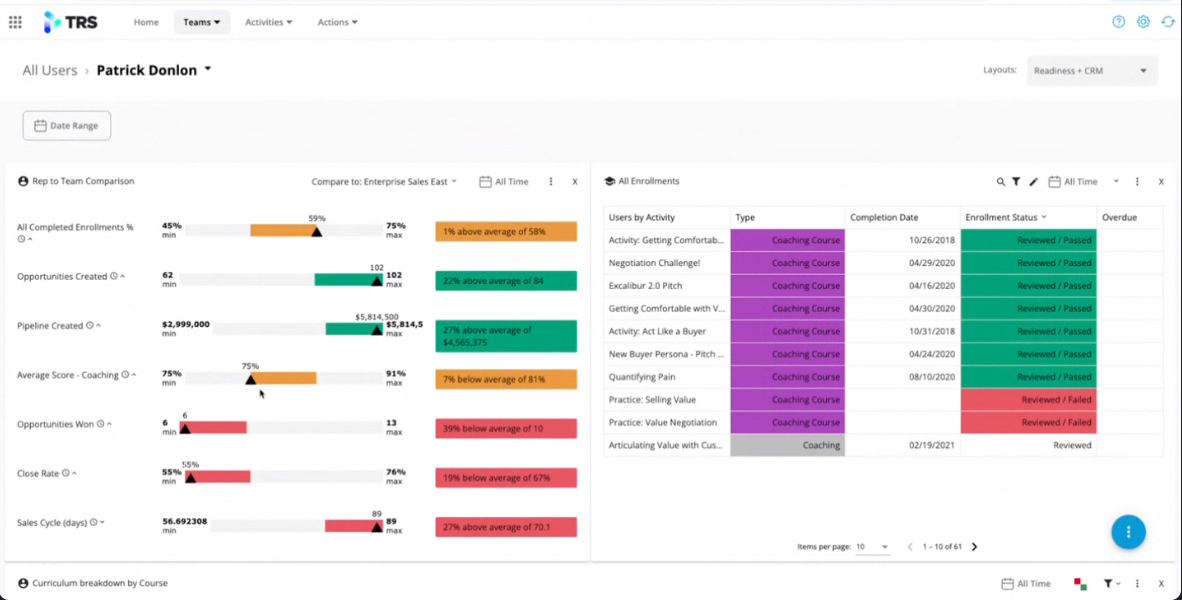
Here, you can see Patrick Donlon’s performance in the following metrics compared to his team, Enterprise Sales East, to understand where he’s struggling or succeeding compared to the group:
- Opportunities created
- Pipeline created
- Average coaching score
- Opportunities won
- Close rate
- Sales cycle length
You might ask:
Are a few individuals bringing down group metrics or is the whole group struggling?
Is a lack of training to blame or is it a larger problem with product/market fit, messaging, or something else outside of enablement’s control?
Are reps passing their enrollments but still struggling to make quota?
What’s the average sales cycle length for the team? (This is valuable information for the whole organization.)
Do lower course or coaching scores correlate to close rates?
This view lets you answer these questions and work toward the resolution, whether it’s within your realm of expertise or you need to escalate it to sales and executive leadership.
Because now you have the data to do that.
Connecting training programs to revenue, A real life example
Allurion Technologies has seen an 850% ROI in professional education with their on-demand learning program executed through Brainshark/Bigtincan.
And no, that’s not a made-up number.
Matthew Wright, VP of Global Professional Education at Allurion walks you through their process:
So that’s how you connect sales training to pipeline as an enablement manager. But what about sales enablement content ROI?
We’ve got you covered. Check out From insight to action: Seller engagement insights enablement practitioners can use to improve content adoption
And be sure to follow Brainshark on LinkedIn to tune into a regular feed of enablement insights.