Customer demands change rapidly, and businesses that don’t keep up will find it difficult to secure new prospects. However, improving sales activities isn’t only about finding the most effective approaches. It starts with tracking and analyzing the right sales performance metrics.
In this blog, we uncover 10 fundamental sales metrics that matter for most businesses, plus how to calculate them. Having this data at hand will help you see the detailed, tangible impact of your sales efforts, and help you find the perfect solutions to enhance your sales strategies.
What is a Sales Metric?
A sales metric is a quantifiable representation of your sales progress.
Some of the examples are conversion rate, sales cycle length, and churn rate.
Related: A-Z glossary of sales terminology
Keep in mind that every business has a different set of sales metrics that they should focus on. This is typically based on their industry, goals, sales strategies, target customers, etc.
Sales metrics serve two general functions: they provide a comprehensive view of the sales performance and guide companies in making data-driven decisions instead of guesses.
Furthermore, frequent tracking of sales metrics can lead to:
- Prompt detection of bottlenecks in the sales pipeline
- Improved sales methods
- Better customer retention and higher profits
10 Most Important Sales Pipeline Metrics
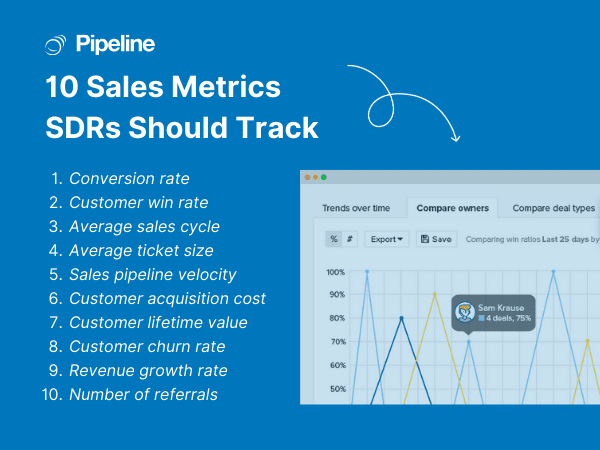
Now that you know how important it is for every business to monitor their sales metrics, we’ve gathered some vital sales KPIs. It is recommended to do this on a regular basis (monthly, quarterly, or yearly) so that you’ll always have accurate data on your business’ growth.
1. Conversion Rate
Conversion rate, also known as pipeline conversion rate, measures your success in moving a lead to the next stage in a sales process. For example, from a marketing qualified lead (MQL) to a sales qualified lead (SQL). This means the conversion rate doesn’t always represent the number of actual sales. It only shows the progress of a lead moving from one stage to the next.
By moving your leads down the funnel, they will (hopefully) become a paying customer.
To calculate the conversion rate, use the following formula:
| Conversion rate | = | Number of leads that moved to the next stage | x | 100% |
| Total initial number of leads |
For a better use of this data, compare the numbers against past results. If there is a decline or stagnation in growth, you may want to tweak your campaigns and sales tactics. Conversely, if the rate increases, your sales team is doing a fantastic job in nurturing the prospects.
2. Customer Win Rate
Your win rate calculates the number of opportunities your sales reps converted into sales.
It may seem similar to the conversion rate, but the former measures the number of leads moved to the next stage of the pipeline, while the win rate tracks opportunities that turned into deals.
The formula to measure the win rate is:
| Win rate | = | Total number of closed deals | x | 100% |
| Number of opportunities |
3. Average Sales Cycle
The average sales cycle measures the total time a sales rep takes to close a deal (from the first point of contact to conversion). Companies typically use average sales cycles to detect efficiency issues in the sales process. By pinpointing the exact problems, businesses can focus on a single sales step and find the right solution to reduce the cycle length.
Use this formula to calculate the average sales cycle:
| Average sales cycle | = | Total number of days to convert leads into customers | |
| Number of closed deals |
4. Average Ticket Size
Average ticket size calculates how much your customers typically spend in a single transaction.
This metric helps companies see the customers’ purchasing behavior and analyze the general sales trends. If the number isn’t up to your expectations, try applying some promotional tactics, such as bundling some products with lower prices or giving away discount codes to boost sales.
Here’s the formula to calculate the average ticket size:
| Average deal size cycle | = | Total value of all deals in your pipeline | |
| Number of deals |
5. Sales Pipeline Velocity
Sales pipeline velocity measures how quickly your prospects move through your sales funnel and generate revenue. It is a vital metric to focus on when you want to adjust the company’s sales strategy and calculate how many resources you need to close a deal. This includes the number of sales reps you should employ, the advertising budgets, the effectiveness of marketing and sales approaches, and lead sources, among others.
The formula for calculating sales pipeline velocity is:
| Sales pipeline velocity | = | Number of opportunities x win rate x deal value | |
| Sales cycle length |
6. Customer Acquisition Cost
Customer acquisition cost (CAC) measures the total expenses spent on turning a lead into a customer. Keep in mind that CAC varies according to industries, products and services, and revenue models. For example, some may focus on paid marketing to generate new leads, while others may spend more on traveling costs to meet and entertain clients in person. Therefore, instead of comparing your CAC with other businesses, focus on how much profit your sales efforts bring to the company. Here is the formula for calculating customer acquisition cost:
| Customer acquisition cost | = | Total sales and marketing expenses | |
| Number of new customers |
7. Customer Lifetime Value
Customer lifetime value (CLV) measures how much a business can earn from a customer throughout the duration of their relationship. In other words, it calculates an estimation of the total net revenue from a customer over their entire association with the company.
Because of this, if you have a high CLV, you’re likely to have a low CAC and high profits.
In contrast, if your CLV is low, you’re likely to spend too much on the acquisition costs, but the customer doesn’t contribute much to your overall profits.
This high-value metric also gauges customer loyalty and drives companies to take measures to enhance it. Use this formula to calculate customer lifetime value:
| Customer lifetime value | = | Average order value x average customer lifespan x average purchase frequency |
8. Customer Churn Rate
Customer churn rate signifies the percentage of customers who cancel your services or subscriptions in a fixed period. A high churn rate can point to several issues, such as:
- Poor product quality
- Lack of customer support
- Poor customer targeting
- Lack of focus on customer needs, etc.
To calculate the customer churn rate, use the following formula:
| Churn rate | = | Number of unsubscribes in a period | x | 100% |
| The initial number of subscribers in that period |
9. Revenue Growth Rate
Revenue growth rate calculates the annual growth of a company. Although this metric requires a longer time span compared to others (one year vs. month or quarter), it is also important to see the changes from a higher perspective, especially if you have just started a new business or sales strategy.
Generally speaking, brand popularity doesn’t come overnight, and new sales approaches won’t show its true result immediately. Only after a few months can you accurately analyze whether to continue or ditch the new sales plans. Additionally, calculating revenue growth rate is also beneficial when aligning your business strategies with your long-term goals. It gives you a solid foundation to set up the priorities for next year’s sales plans.
Use this formula to calculate your company’s revenue growth:
| Revenue growth | = | (Current period’s revenue – previous period’s revenue) | |
| Number of new customers |
10. Number of Referrals
Higher referral numbers pose several benefits for a business, including:
- Enhanced business credibility
- Better conversion rates
- Boosted brand awareness
- Higher customer loyalty
It also drives better lead generation than paid advertisements.
In fact, marketing experts rate word-of-mouth leads a 4.18 on a 5-point scale in quality.
The number of referrals metric is also one of the simplest ones to calculate. You can do this manually or use a platform like Rewardful to handle all referral and affiliate marketing-related tasks, including tracking new referrals, monitoring referral traffic, and setting up campaigns.