
As CEO of InsightSquared, I am extremely excited to share that Mediafly, the leader in sales enablement, is acquiring InsightSquared, creating a world-class revenue intelligence and enablement experience for B2B teams. Having spent three decades in sales and marketing leadership roles and been fortunate to witness several significant disruptions driven by technology, I am convinced of three things: We are on the cusp of advancements that will change the game within the revenue functions of B2B companies. Activity and engagement analytics are the keys to assessing the health of a deal and the strength of the overall pipeline. There will…
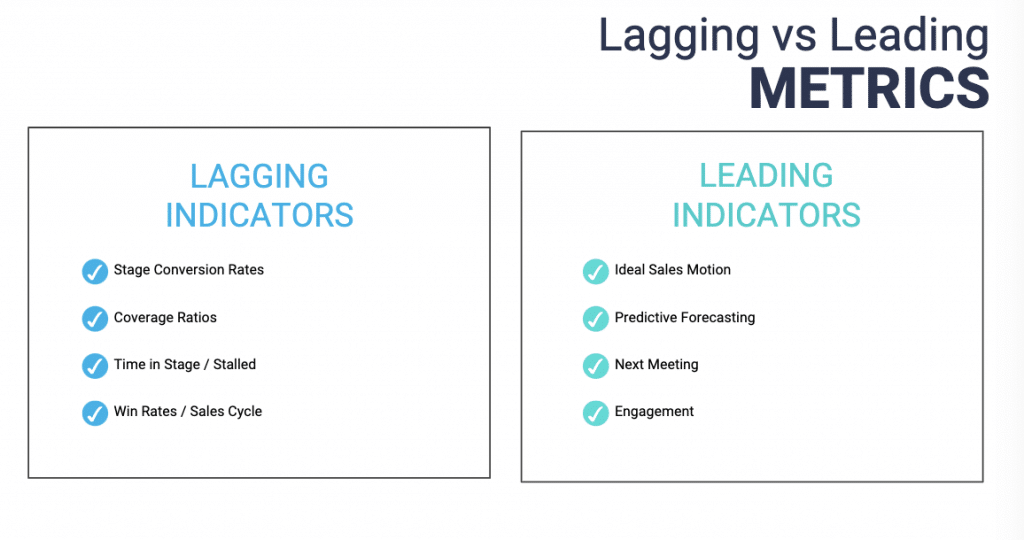
When it comes to measuring the health of your pipeline and forecasting the quarter, are you focused on Lagging Indicators that leave you looking in the rear-view mirror? What if you instead focused on Leading Indicators? The metrics that help you get ahead of risks and upside. Those that allow you see your pipeline in a new light.
In the webinar, “From Lagging to Leading: The Essential Sales Metrics You Don’t Want to Miss,” InsightSquared’s, James Davison, Chief Product Officer, and Lynn Herman, Senior Customer Enablement Consultant, share tips on taking advantage of both Lagging and Leading Indicators. Watch the on-demand recording here.
Revenue teams are buried in data. We use it to keep a finger on the pulse of our businesses; numbers don’t lie, after all. Yet, whether you are looking at Coverage Ratios, Time in Stage or even Win/Loss Rates — these metrics all show you where you are, rather than predicting where you will land. It’s valuable, but not enough if you want to assess data pipeline health or confidently report forecast goals to the board.
According to Gartner, “Sales organizations want to gain insights into the health of their business and the top drivers of their sales deals, but rely too often on static backward-looking sales KPI reporting capabilities from their sales force automation (SFA) solutions or BI platforms.”
Powerful Combination of Lagging + Leading = Clarity
Want to put your sales team in the driver’s seat? Balance your traditional Lagging Indicators, like Stage Conversion Rates, with Leading Indicators, such as Ideal Sales Motion and Predictive Forecasting.
What does that look like in practice? Imagine predicting when a deal is going to stall well before it does. Or that a competitor is a much more viable option than you realized, your point of contact is too low level or the decision-maker isn’t engaged. You have more data than ever; it’s now time to analyze it in ways that help you take control of the journey. The business impact is massive. Consider:
- Managers coach more effectively and get the deal back on track
- Reps learn to effectively position against the competition
- Gain executive reach out directly to the decision maker
Overall – it’s the agility your team has been waiting for. The power and confidence to adapt quickly to changing scenarios. To increase or decrease your forecast with precision, and focus your efforts on the deals with the best likelihood to deliver.
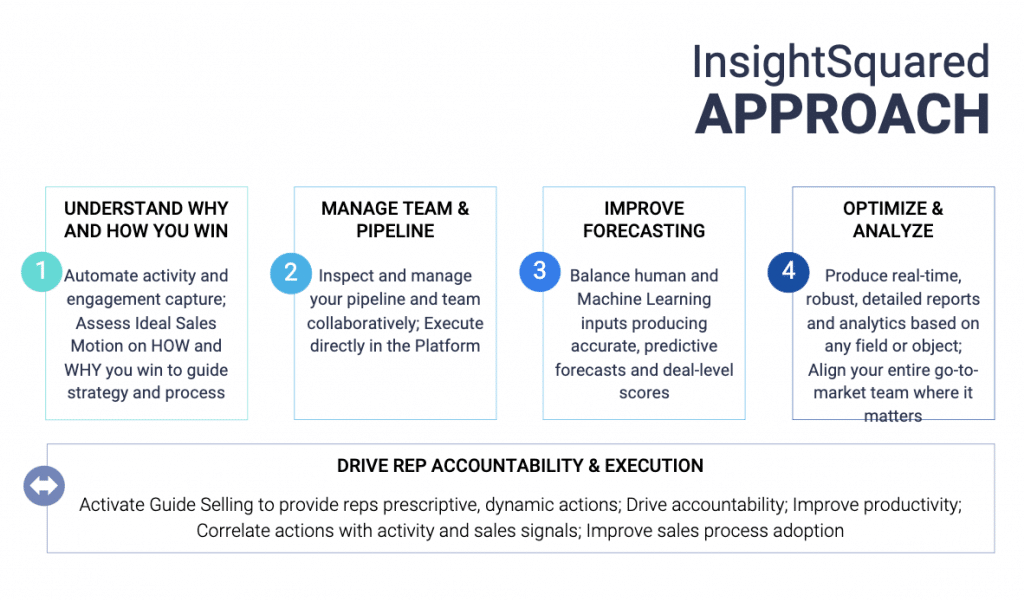
Use Historical and Present Data to Predict the Future
As previously mentioned, most B2B companies have more data on their customers and their overall sales engagements than ever before. The question is what are you doing with it? If you aren’t using it to look ahead, you are missing a prime opportunity to drive more conversions and wins.
Today, Machine Learning models can assess current activities and engagements to correlate them with historic scenarios to predict what is likely to happen.
Let’s set the stage. You’re a sales manager in a pipeline review meeting with your rep. You now have a real-time look at Activity by Day, a complete view of the deal’s health and predictive deal scores based on Confidence to Close. It’s a powerful toolkit to avoid risk, improve pipeline velocity, and discover coachable moments.
Ready to take your sales team to the next level with the power of both Lagging and Leading Indicators? Schedule a demo to see how InsightSquared’s machine learning-driven platform can help you get there!
You Might Also Like…

Mediafly & InsightSquared join forces to help revenue teams improve forecast accuracy, enhance buyer engagement and increase revenue production. Mediafly, a leader in sales enablement, interactive content and value selling, today announced it has entered into a definitive agreement to acquire InsightSquared, a leader in revenue intelligence, forecasting and analytics. The combined revenue enablement and intelligence platform, a first of its kind, provides customers a 360-degree view of what’s happening at every stage, in every account to improve coaching, engagement, predictions and execution throughout the customer journey. Despite a digital-first selling environment, today’s B2B revenue leaders forecast, prioritize and create…
Is your sales team getting the most out of their data? If you’re like most companies, the answer is, unfortunately, probably not. In fact, a 2018 study by Gartner indicated that a whopping 87% of organizations have low business intelligence and analytics maturity. Yes, you read that right. Almost 90% of companies aren’t benefiting from their data in all the ways they could—and should—be. So what’s the answer to this problem, and how do you develop better business intelligence and data maturity? It’s a pretty big issue to solve with any one strategy. However, using sales metrics dashboards that are…
