11 Sales Report Templates & Examples: How to Create a Sales Report Fast

As a sales manager, you have a lot of responsibilities on your plate—including the task of creating sales reports that executives can quickly wrap their heads around.
Aside from managing your sales team, providing coaching, and ensuring growth, sales managers and directors are also tasked with collecting the right data and presenting it to leadership.
 |
I know firsthand, this can be a bit overwhelming. The good news is that creating an effective sales report doesn't have to be stressful. With the right tools and a solid sales report template to work with, you can create an actionable sales report in just a few minutes.
Before we talk strategy, let's quickly talk about what a sales report really is and which data points it should include.
What is a Sales Report?
A sales report (also known as a sales analysis report) is a document outlining your sales activity and the impact of that activity over a specific period of time. The details can vary, but typically include metrics about leads, new accounts won, revenue generated, and overall sales performance.
Sales managers and other stakeholders use this data to understand overall sales activity and sales team performance, spot issues in the sales process, and make more informed business decisions.
The sales report may also map out effective growth strategies, identify the company’s ideal customers, and outline strategies to streamline the sales process.
Sales reports are usually created by team leaders or sales managers, and are formatted to communicate important data to specific teams or leaders effectively.
You can design your sales report as a multi-page document, an Excel document, a graph, or even a graphic presentation.
How to Write a Sales Report in 5 Steps
Anyone can stuff numbers into a report and drone on in a long meeting. The real challenge is creating a sales report that communicates the right data about the sales process and doesn’t put your audience to sleep. That requires a special touch.
Here are five steps to creating a successful sales report that won't bore your audience to tears.
1. Identify the Purpose of Your Sales Report
Obviously, the purpose of your report is to share sales metrics. But you can’t possibly fit in every bit of sales data. Instead, focus on the data that helps you or the company achieve specific goals.
Ask yourself why you’re putting together a sales report in the first place. Are you measuring the effectiveness of your promotional campaigns? Do you want to identify interesting sales trends for a sales forecast? Is your sales report designed to motivate your team or make sure they're making enough outbound calls? Or is it a useful snapshot of sales KPIs for your sales operations team to work with?
The purpose of your sales report will help you gather and analyze the right kind of data. It will also help you determine the scope of your report, like the time period to report on.
 |
2. Know Your Sales Report's Audience
Once you know exactly why you’re creating a sales report, the next step is defining your audience so your report can focus on the information they care about.
You wouldn't send the same cold email to a CEO and a marketing director, right? You shouldn't send them the same sales report, either.
A marketing head, for example, is likely interested in details like which marketing campaigns led to the most profitable sales. Your sales director is likely interested in if reps will meet their quotas.
But the CEO and other decision-makers are more interested in the “big picture,” such as the overall growth of the company, instead of the specifics of every campaign.
3. Gather Your Sales Data
Now that you've outlined the purpose and audience for your sales report, it’s time to gather sales data, filter the information, and analyze it. This is the fun part! (Or maybe that's just me.)
Make sure your data collection process is goal-oriented and hassle-free. If possible, use tools that integrate with your CRM or other sales software —this will make pulling the data a lot easier.
Start by outlining the metrics you want to include in your report and overall trends you think matter. A standard sales report includes core KPIs, team performance, number of goods sold, net revenue retention, net sales, profits, and customer acquisition costs.
You might also include sales growth, regional sales, new opportunities, team performance, or other relevant metrics.
To improve data accuracy, you'll need to clean up or filter the data to remove duplicate records and focus on specific areas. For example, if you're wanting to share sales metrics for North America, you'd exclude international numbers.
Next, define the time period your report will cover. It’s usually a good idea to take two different time periods—current and previous—and draw a comparison. For example, you might compare metrics month over month or year over year.
4. Create Engaging Visuals to Highlight Important Sales Metrics
Have you ever sat through a meeting where the presenter simply reads slides full of text? It's boring—and worse, it's harder to absorb data that way.
The way you present data is just as important as the data itself. This is where data visualization can help. Instead of expecting managers to go through spreadsheets full of numbers, use graphs and charts to clearly illustrate the impact of important data, contributing significantly to sales performance management.
 |
For example, a line graph can show the increase or decrease in revenue over a period of time. A pie chart can illustrate how much each product contributes towards total sales. And bar graphs can be used to compare employee performance.
Visualizing data helps make your sales report easy to understand and digest. It can also highlight important trends and challenges in key sales metrics that might impact sales performance in the coming months.
Plus, using visuals helps you put together a great-looking report that keeps your audience from dozing off.
To create data visualizations, such as graphs, charts, and maps, to use in your reports use a data visualization tool like Google Data Studio.
If your reports highlight challenges/places where you're falling short, consider a SWOT analysis to pinpoint the cause.
Psst...curious about the factors influencing total contract value? Check out our article!
5. Explain What the Sales Numbers Mean
On their own, numbers can be misleading and lead to erroneous judgements.
This is why it is important to always contextualize the data you present, instead of just handing over a bunch of numbers.
What Are the Different Sales Report Types?
There are tons of different types of sales reports, and there's no one right document for every organization. In fact, different teams in the same organization may use different sales reports to highlight different data.
Most reports cover a specific time period, such as daily sales reports, weekly sales reports, monthly, and quarterly sales reports. However, reports may also cover different steps in the sales process.
Here are the most common types of sales reports--and when to use them.
1. Sales Pipeline Report
The sales pipeline report shares the value of your sales pipeline and how the number of deals in each stage of the pipeline. It highlights how many deals could be lost and how many will be won, and how this might impact the company’s overall revenue.
Within the pipeline, all of the key stages of the deals are outlined to provide a clear picture of how daily, weekly and monthly sales cycles are performing.
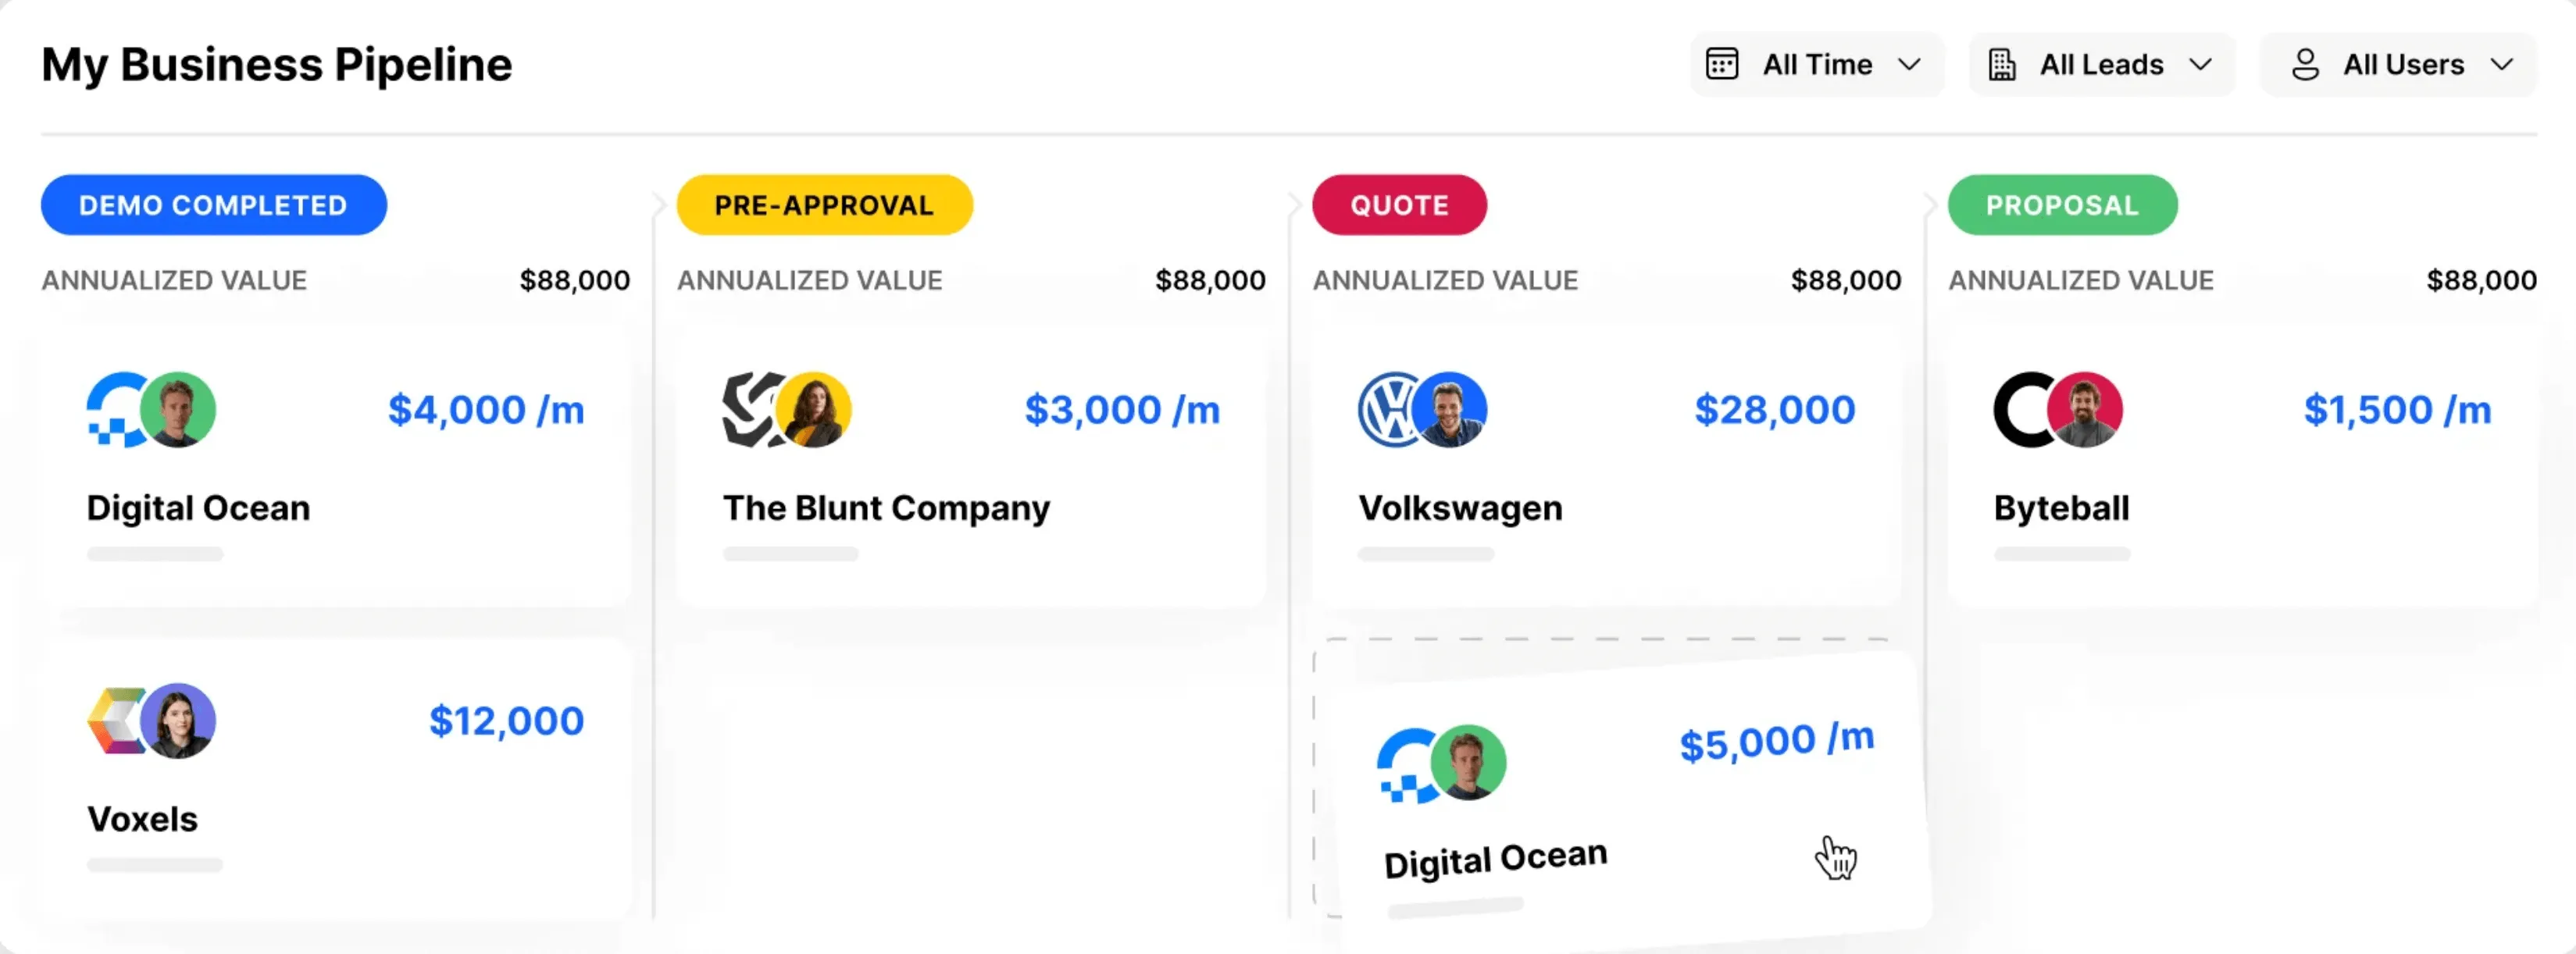 |
Pipeline sales report in Close
Use this sales report to: Showcase success or challenges in your sales pipeline.
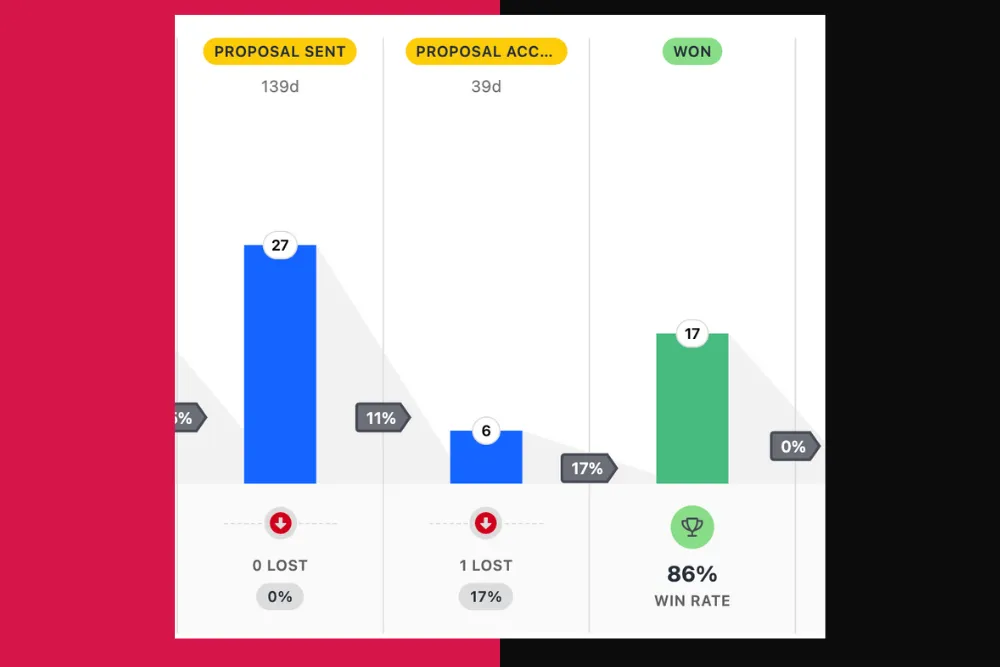
2. Conversion Rate Report
A conversion rate, or win rate, report shows how effectively your sales team is converting new leads into new customers.
 |
Not only does this valuable data provide insights into the strength of your overall sales strategy, but it also highlights sales represenative and sales team performance.
Looking into individual salespeople's conversion rates can show you exactly how that person is performing as well as their overall strengths and weaknesses.
If leads are not moving into won deals and new customers, conversion rate reporting on each stage of the sales process will help you identify areas that need improvement.
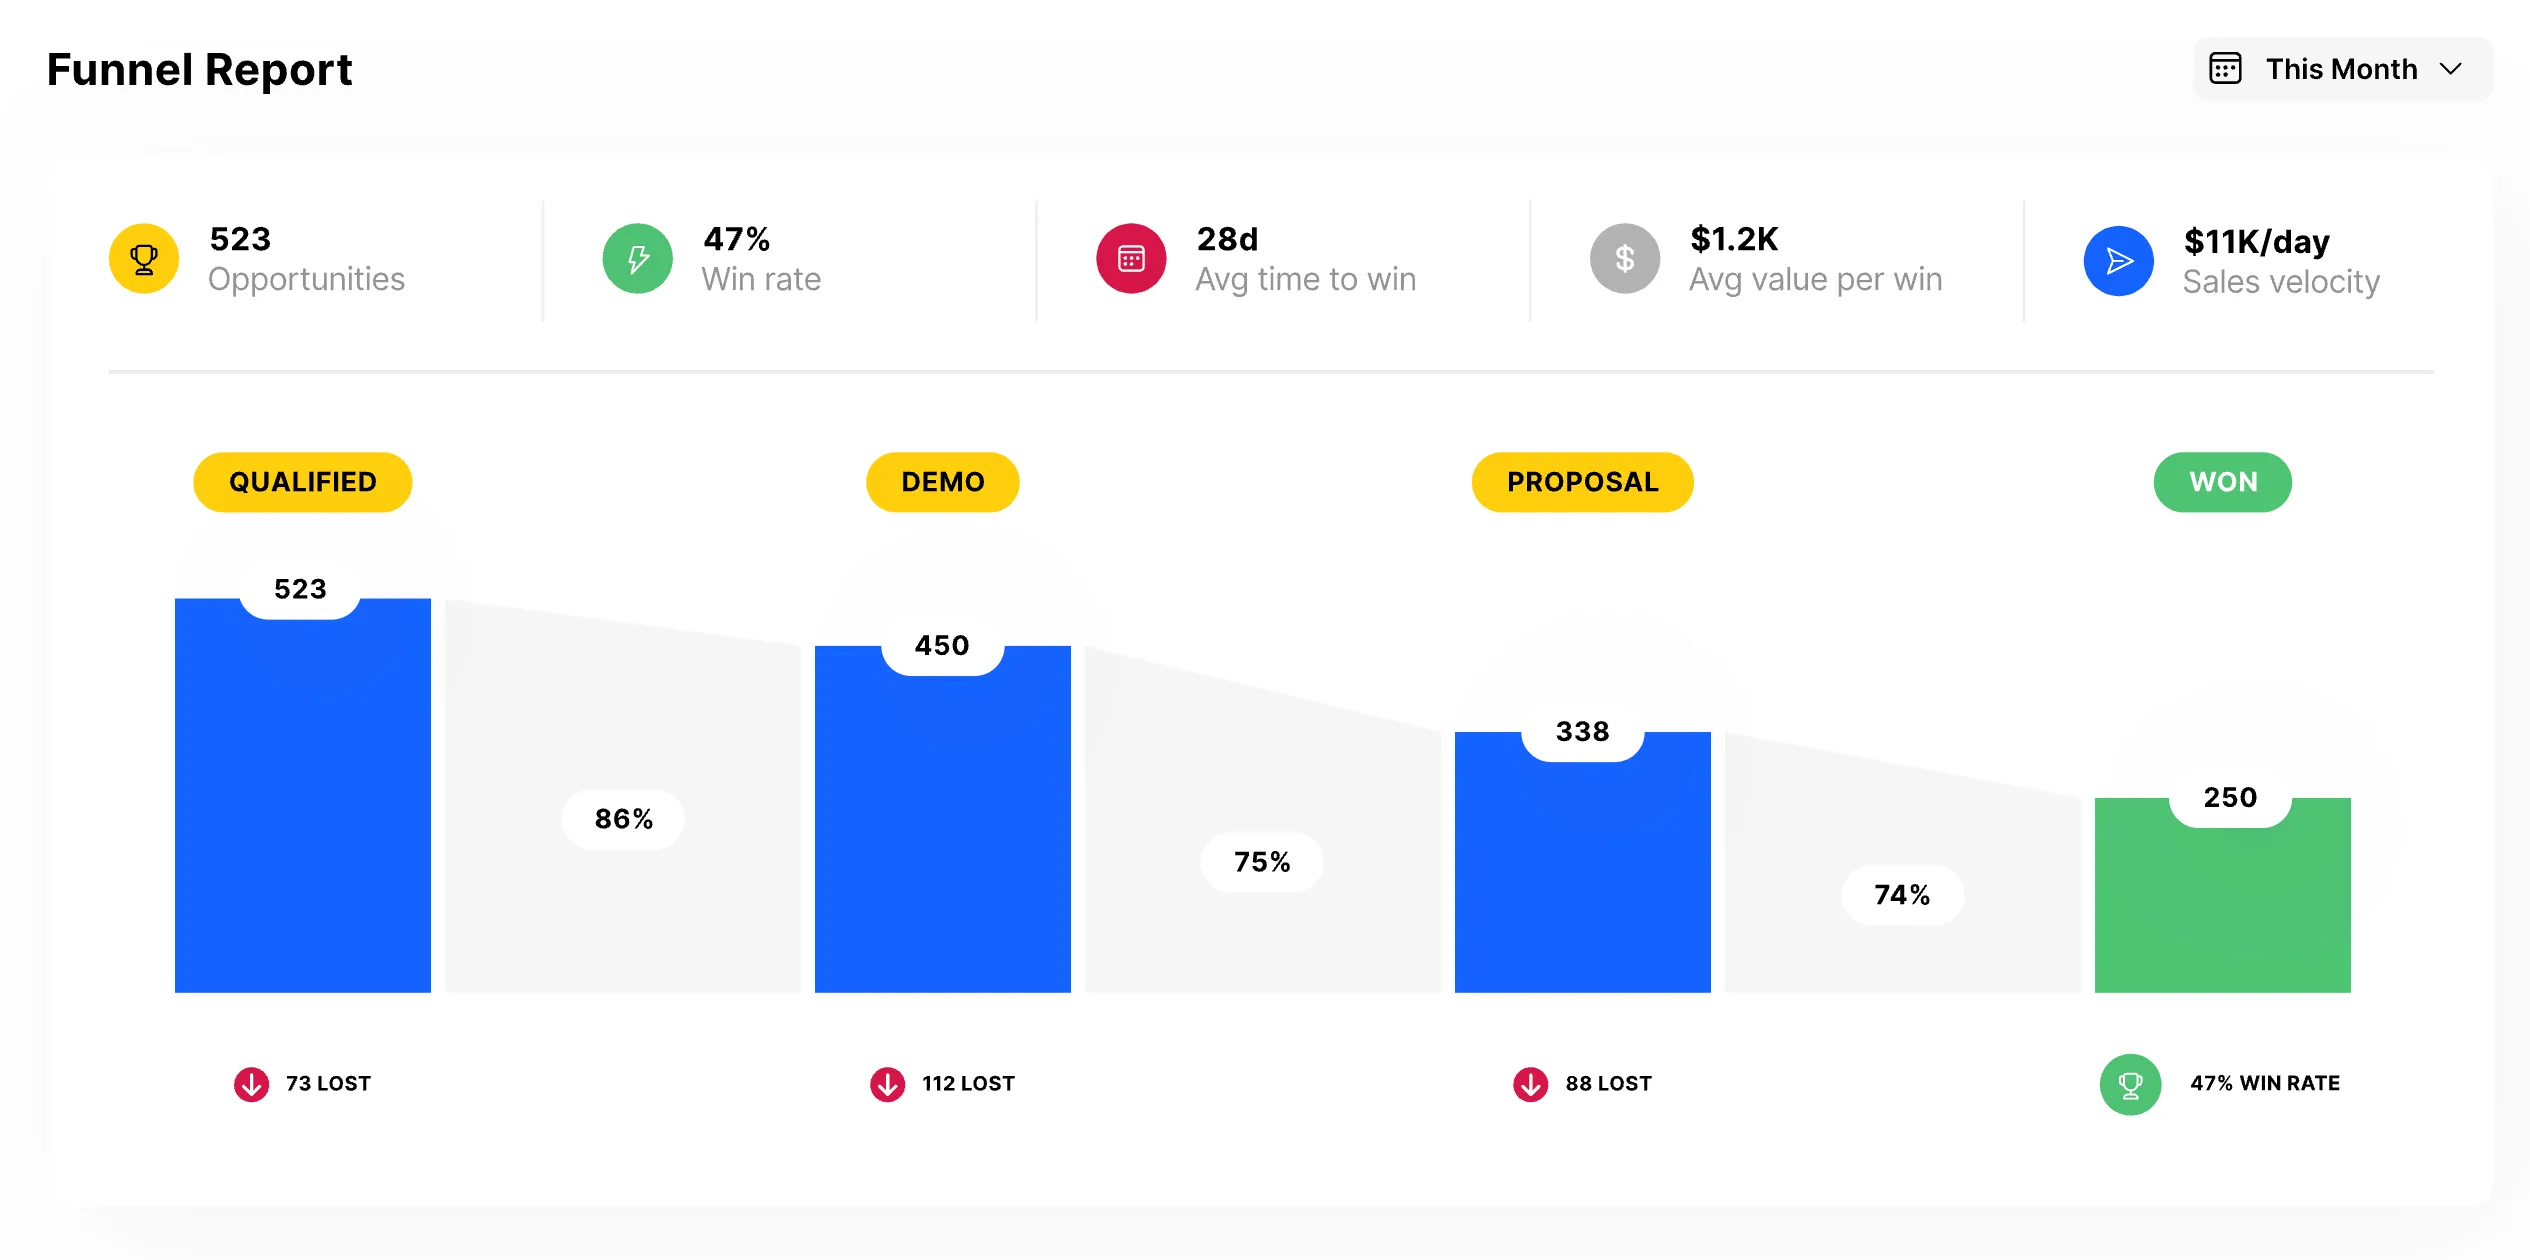 |
Funnel Report in Close
Use this sales report to: Highlight the difference between leads that close and ones that don't or to highlight the difference in performance between sales reps/teams/campaigns.
3. Customer Churn Report
The churn rate shows you the overall rate at which a customer will stop doing business with your company or stop using your product.
Not only will the churn report show you when customers move on, but it can show you why by providing insights into overall trends.
Churn rate matters to sales because a high churn rate could mean you're targeting the wrong prospects.
Use this sales report to: Track the number of customers to churn and traits they share, such as company size, sales rep, lead source, etc.
4. Sales Forecast Report
A sales forecast is a detailed report estimating how much a company, sales team, or salesperson will sell every week, month, quarter, or year.
A sales forecast helps you spot potential problems early on, when it's still possible to avoid or fix them.
In Close, you can easily forecast future sales using the detailed values in the Pipeline View:
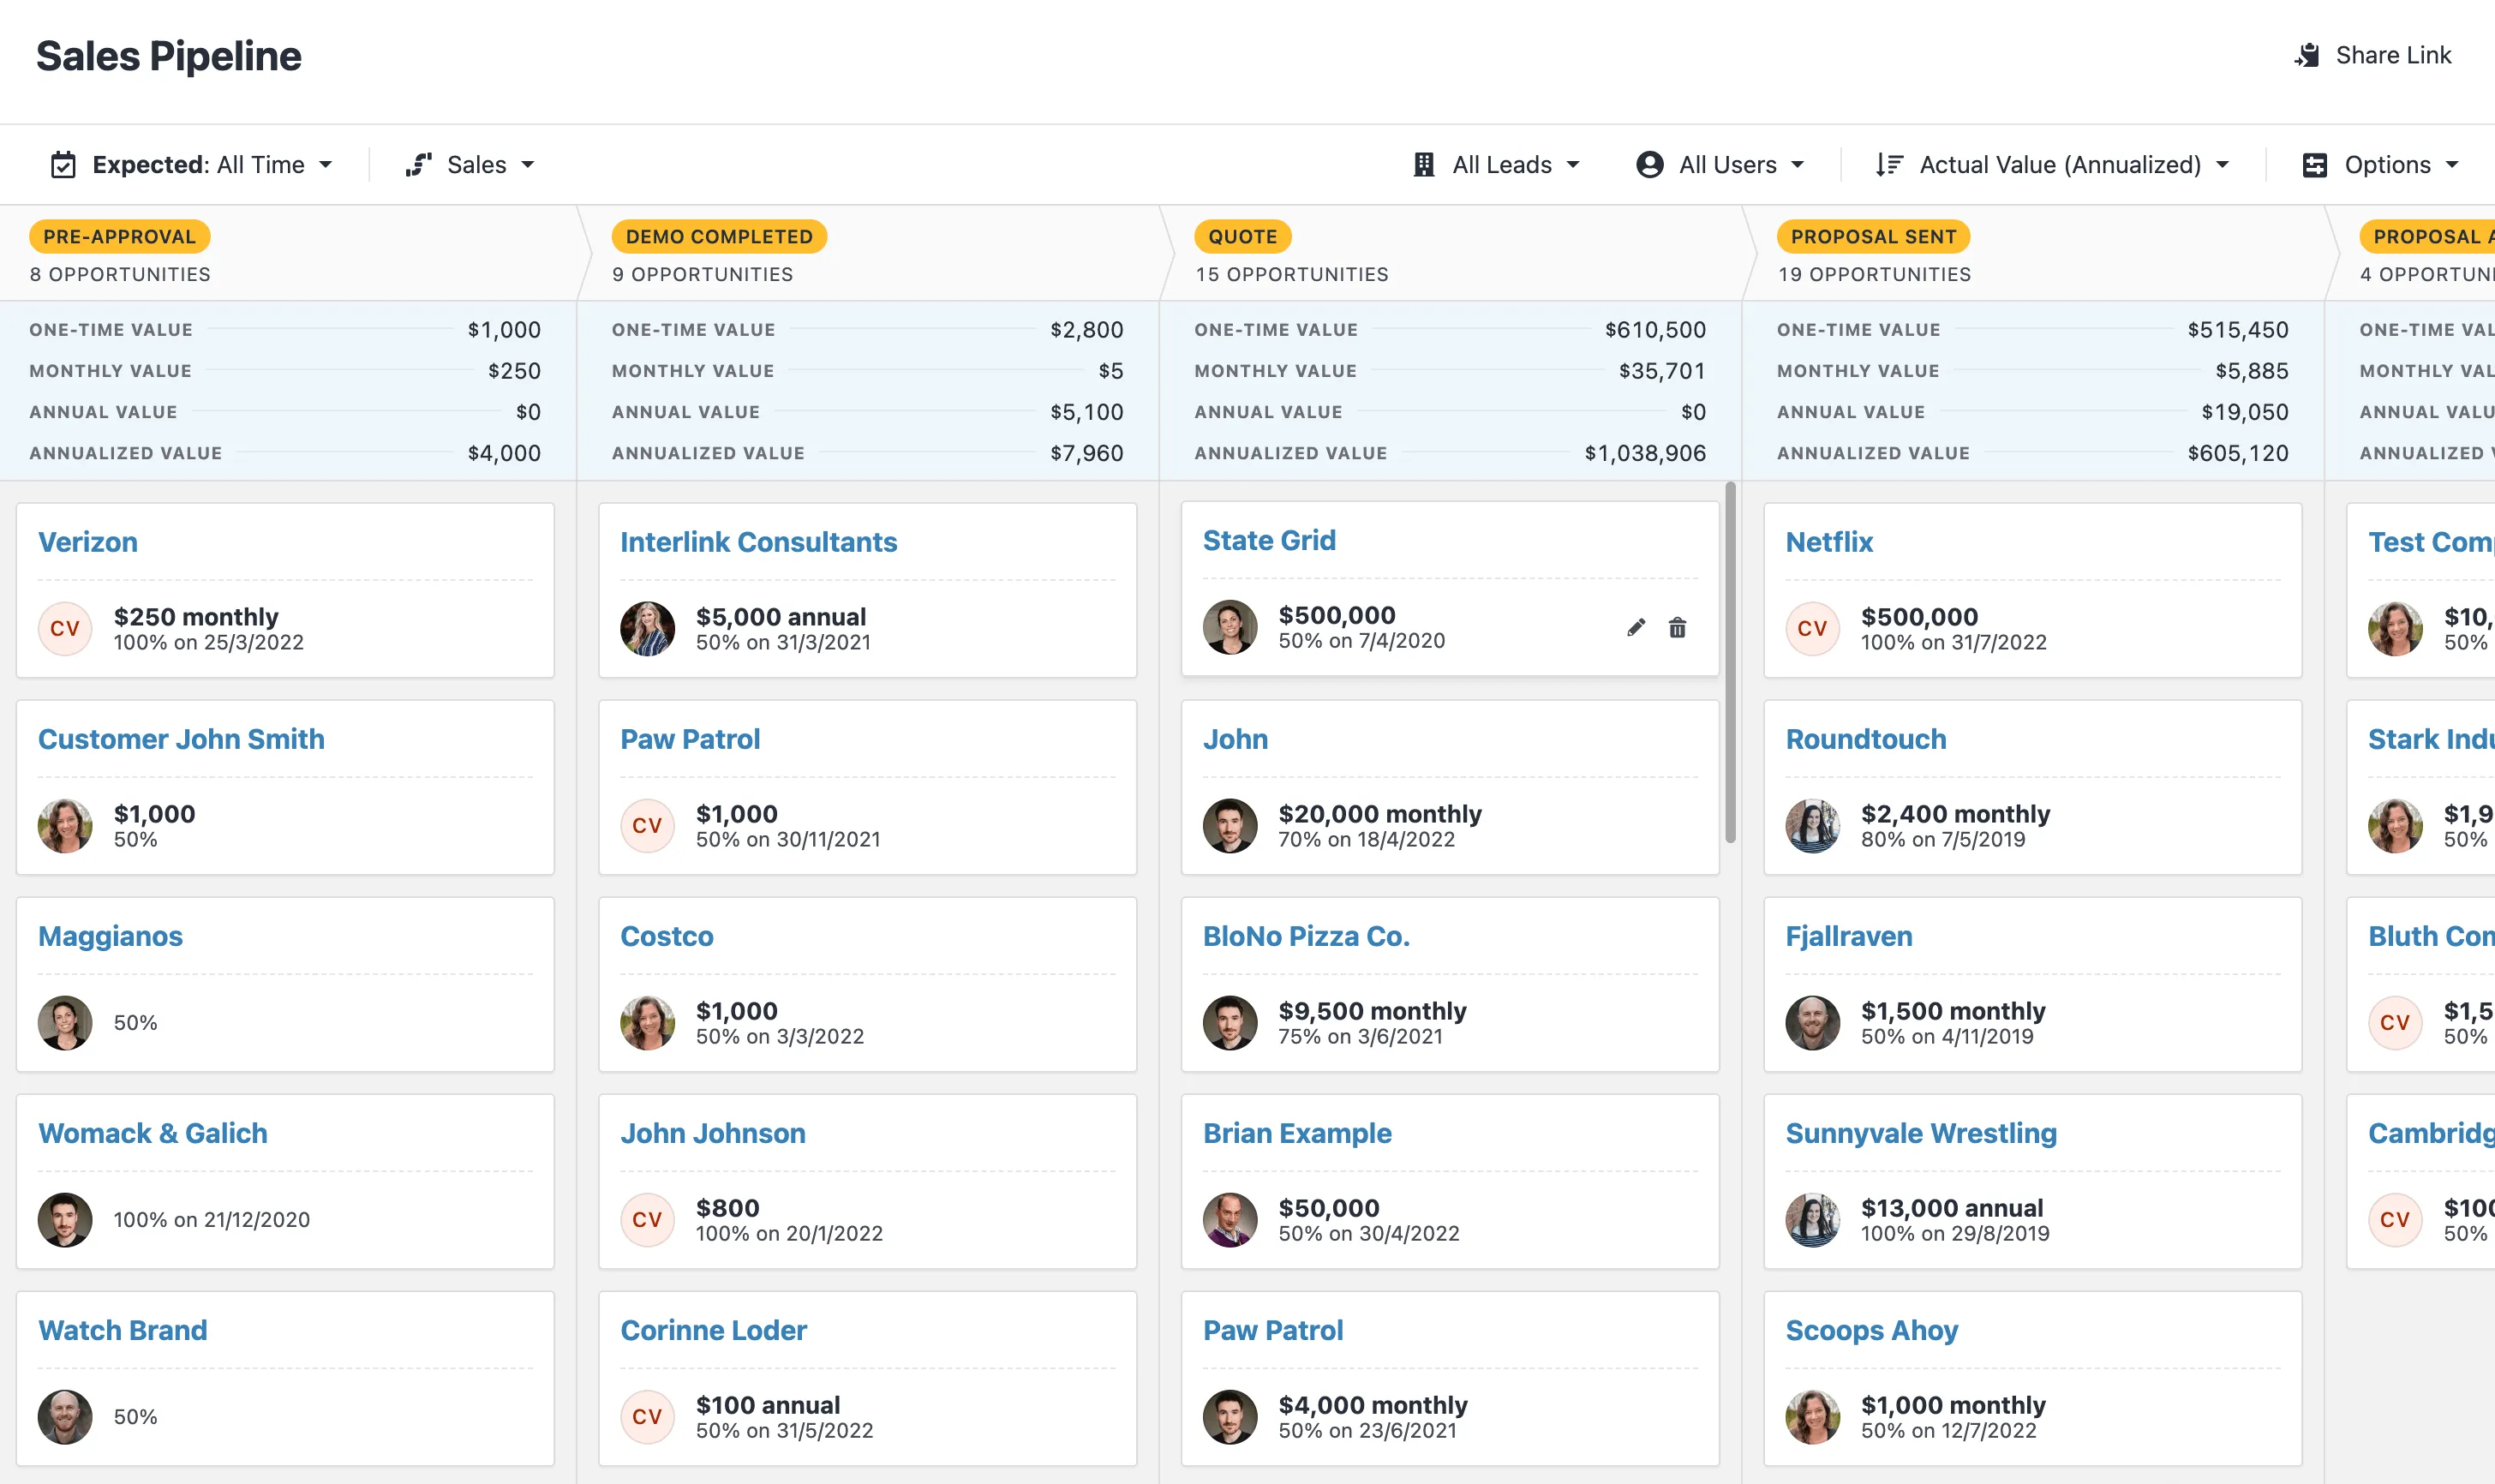 |
Pipeline View in Close
Use this sales report to: Predict future sales by rep, team, location, or lead type.
5. Deals Won and Deals Lost
Tracking deals you win and lose helps you see how the business is doing and how specific sales efforts pay off.
This report will also unlock insights into which of your products are more popular than others.
 |
By using the right data, you can spot the trends relating to top-performing product offerings so you can maximize those opportunities to win more business.
Won and lost reports will also help sales managers understand how their sales teams and reps perform individually.
Use this sales report to: Track trends in won and lost deals by product type, company details, sales teams, or specific reps.
6. Average Deal Size
The deal size report helps you to know how many sales need to happen in order to achieve a specific revenue target.
 |
For example, If every won deal produces $5,000 of revenue and your sales goal is $50,000, then you know that your team needs to close 10 new deals within that time frame.
This can also assist in planning sales capacity and resource allocation.
Use this sales report to: Track the impact of discounts, rep performance, overall business growth, and campaign impact.
7. Sales Calls Report
Track how effective your sales reps are by measuring the number of sales phone calls being made to their prospects.
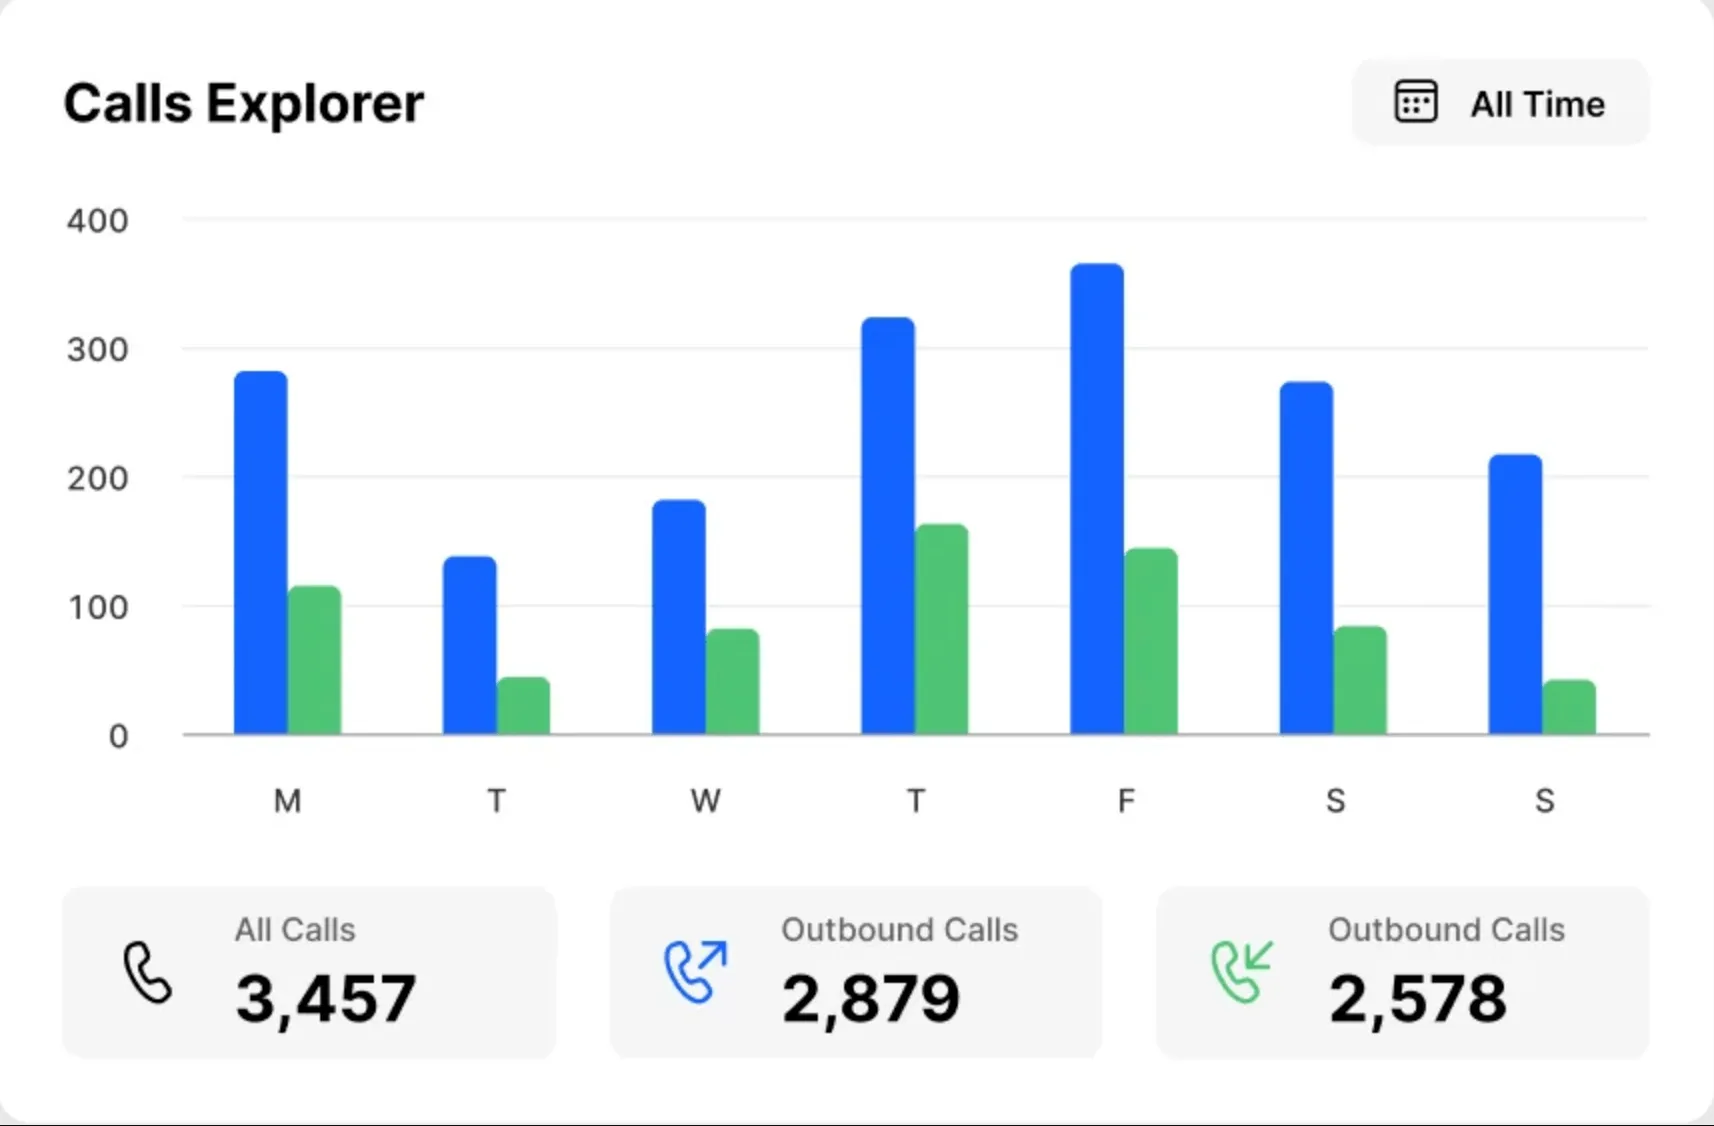 |
Close Call Explorer
This can help you understand if there are any gaps in close rates or any discrepancies between the number of phone calls VS the number of closed deals.
The call reports can also help you to isolate specific metrics and segment data about individual prospects that are being called.
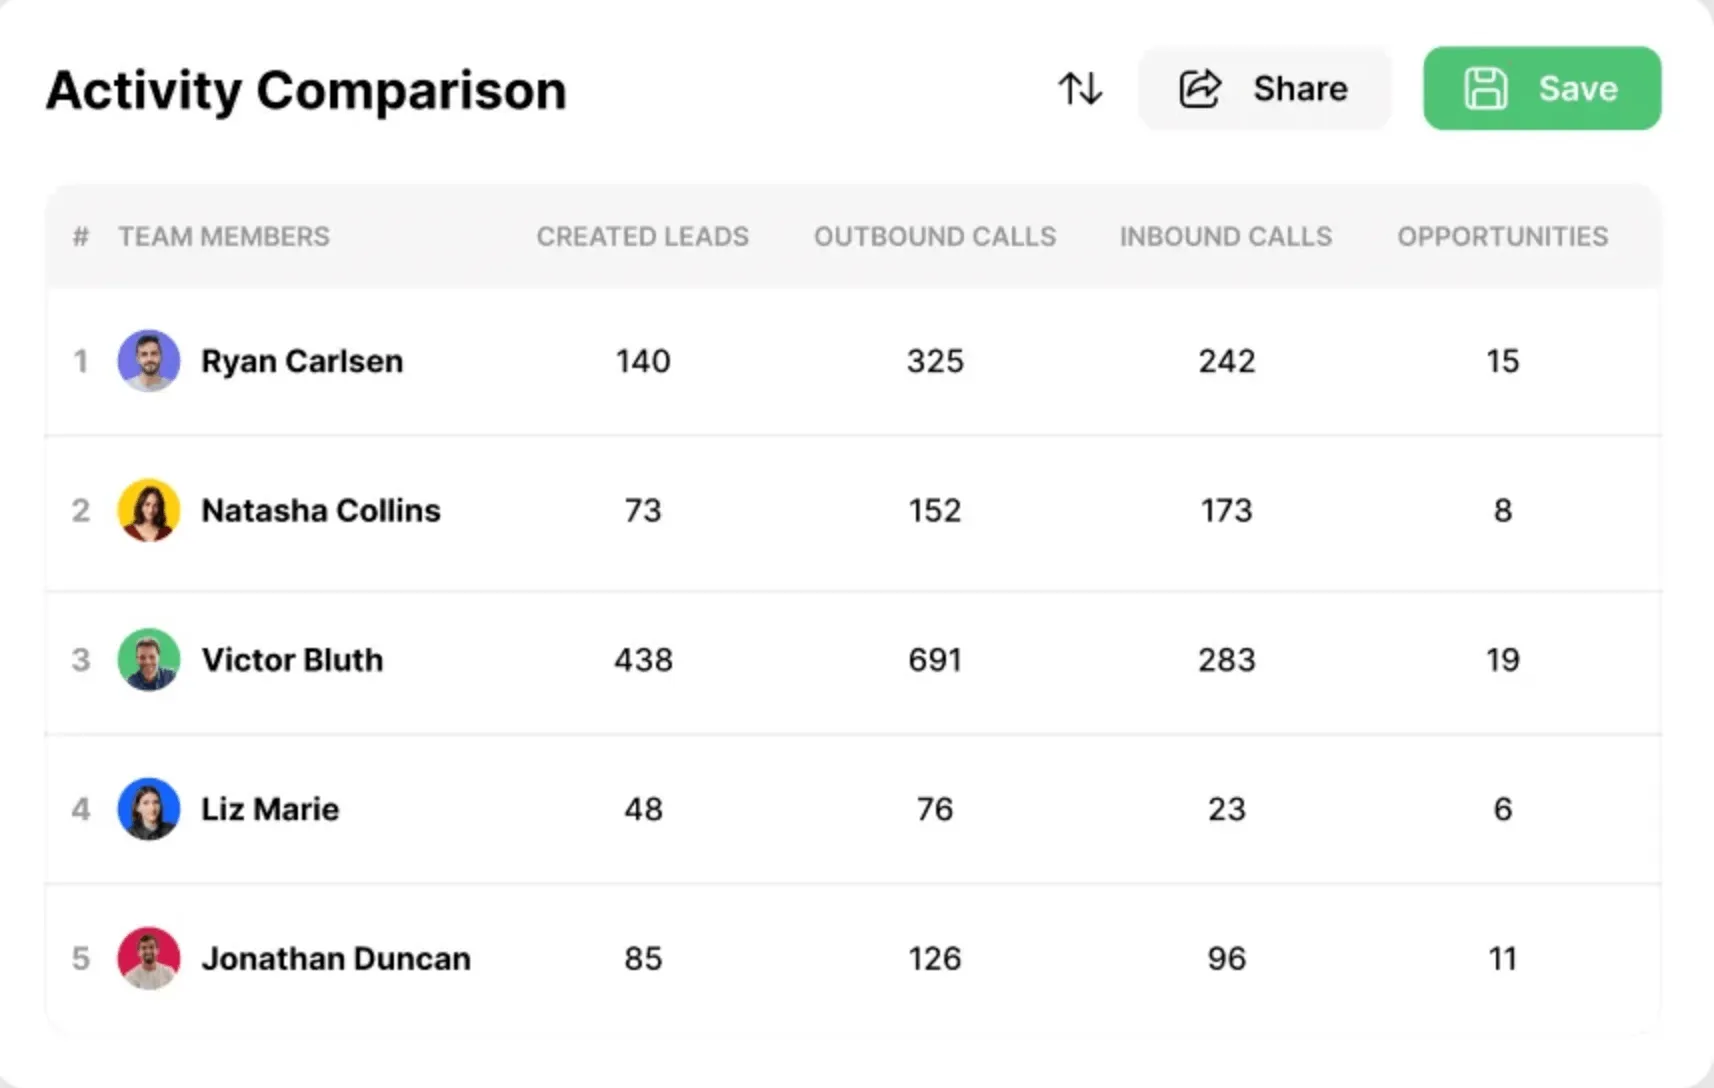 |
Activity Comparison Report in Close
Use this sales report to: Set benchmarks for new hires, gather data about valuable leads, and optimize your sales process.
CREATE YOUR OWN SALES REPORTS IN CLOSE →
4 Free Sales Report Templates (Downloadable in Google Sheets & Microsoft Excel Format)
Now that you understand the importance of sales reports, let’s look at a few of the most popular templates. These templates can be accessed in Google Drive or Excel and easily copied and pasted to make them your own.
1. Daily Sales Report Templates
 |
This is a basic daily sales report template for sales executives that includes access to an extensive inventory list you can use to monitor the sales of multiple product lines. If you’re just getting started and a basic template is all you need, try this free daily sales report template in Google Sheets format (you can also download a Microsoft Excel version), brought to you by SmartSheet.
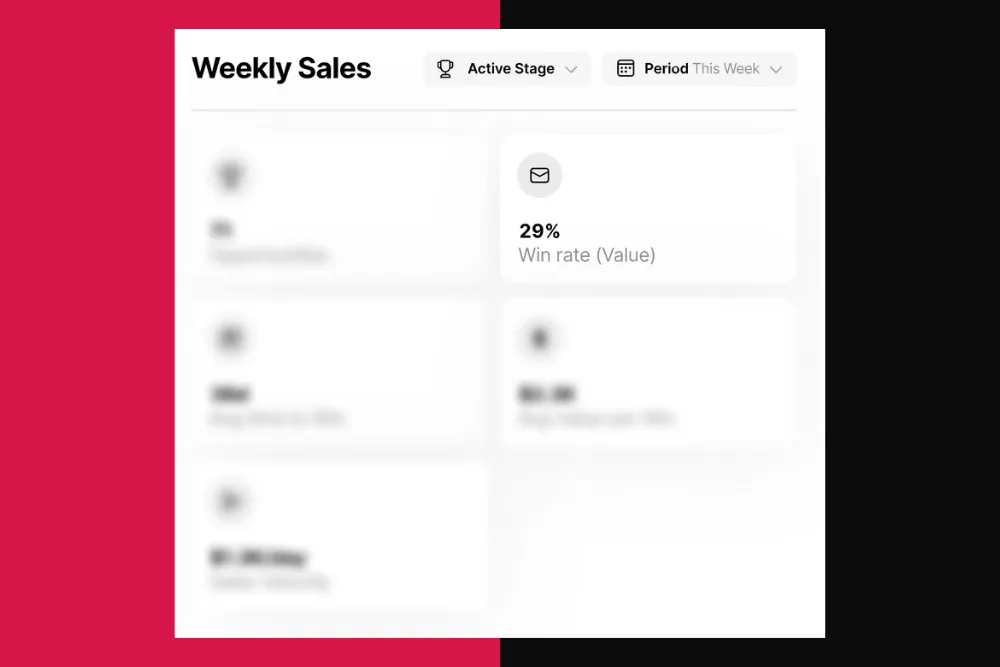
2. Weekly Sales Report Template
 |
Use this weekly sales revenue report template to monitor and keep track of sales activity for a given week against a specific sales goal. Brought to you by Microsoft, this free Google Sheets & Microsoft Excel template allows you to track actions of each salesperson's activities in multiple locations and across several product lines.
3. Total Sales Report Template (with Pivot Table)
 |
Love pivot tables? You'll like this sales report template. This spreadsheet (and Google Sheet) makes it easy to monitor product sales and customer performance over each quarter closely. You can quickly add customer names and sort by product or customer.
You can download the performance report right here in Google Doc format and make a copy to use for your own sales reporting purposes.
4. Sales Forecast Tracker
 |
This monthly sales report template comes from our list of the best sales forecasting templates. It’s designed to help small businesses track sales opportunities, who’s assigned to each lead, which phase in the sales pipeline, and probability of closing the deal.
You can then quickly run basic sales forecast estimates to get a sense of how many deals will actually come through at the end of the month.
Using Sales Reports in Close
Creating sales reports can be a PIA, even when you use a template like the ones we listed above. If those templates aren't quite what you're looking for, try Close's sales reports here.
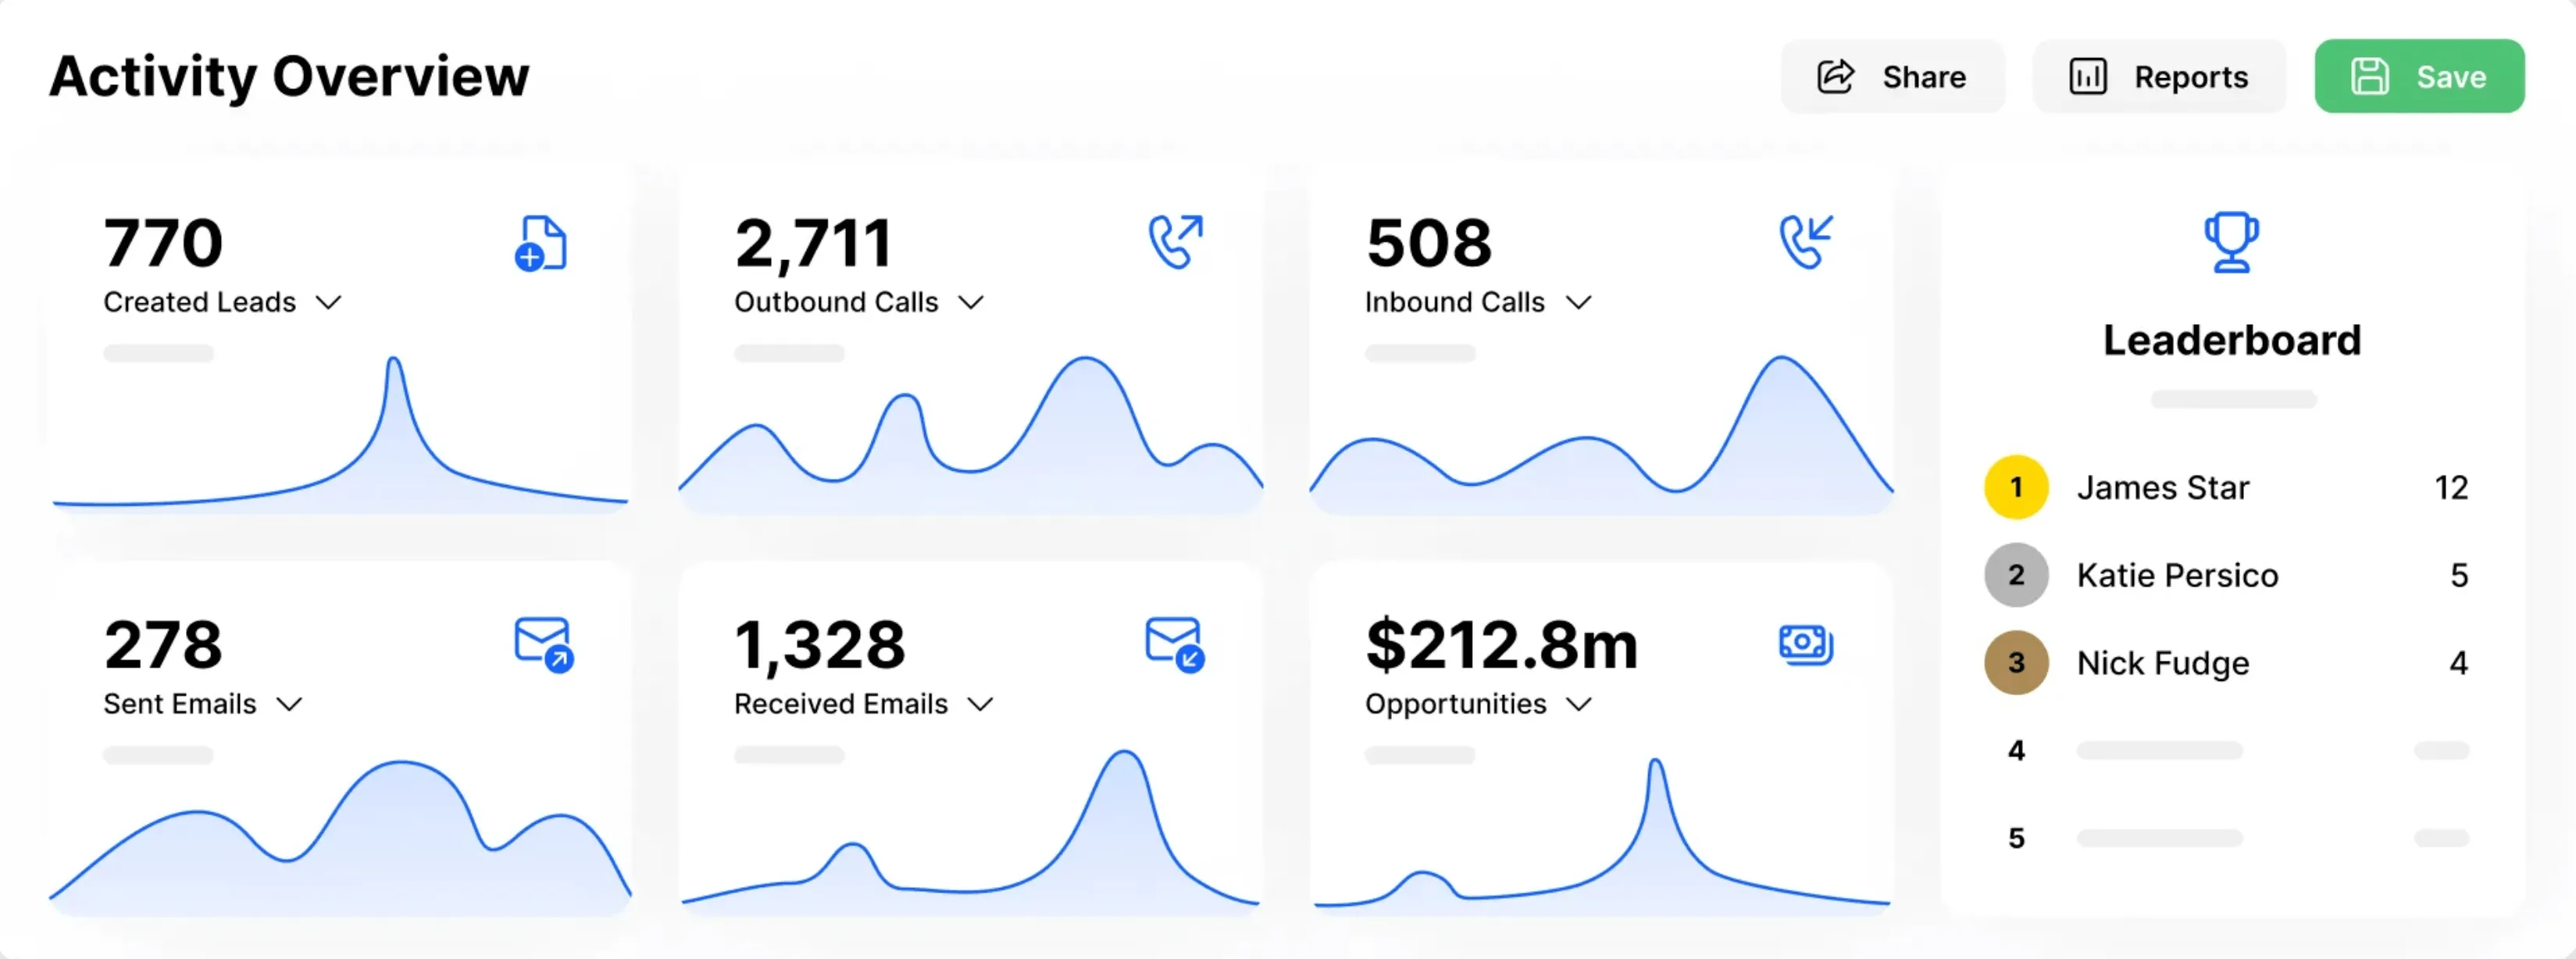 |
Our reports feature tons of data, including real-time sales activity reports, success rate, and a team leaderboard. Even better, no Excel formulas are needed. 🙌
Quick Tips to Improve Your Sales Reports
Whether you are a small business (using a small business CRM) or an enterprise organization with a massive amount of resources, the steps above will help you put together a sales activity report that gets the job done.
If you want to be better than average, however, you'll need to go the extra mile. These strategies will help you create a sales report that delivers actionable data fast. (And makes you look good to your boss.)
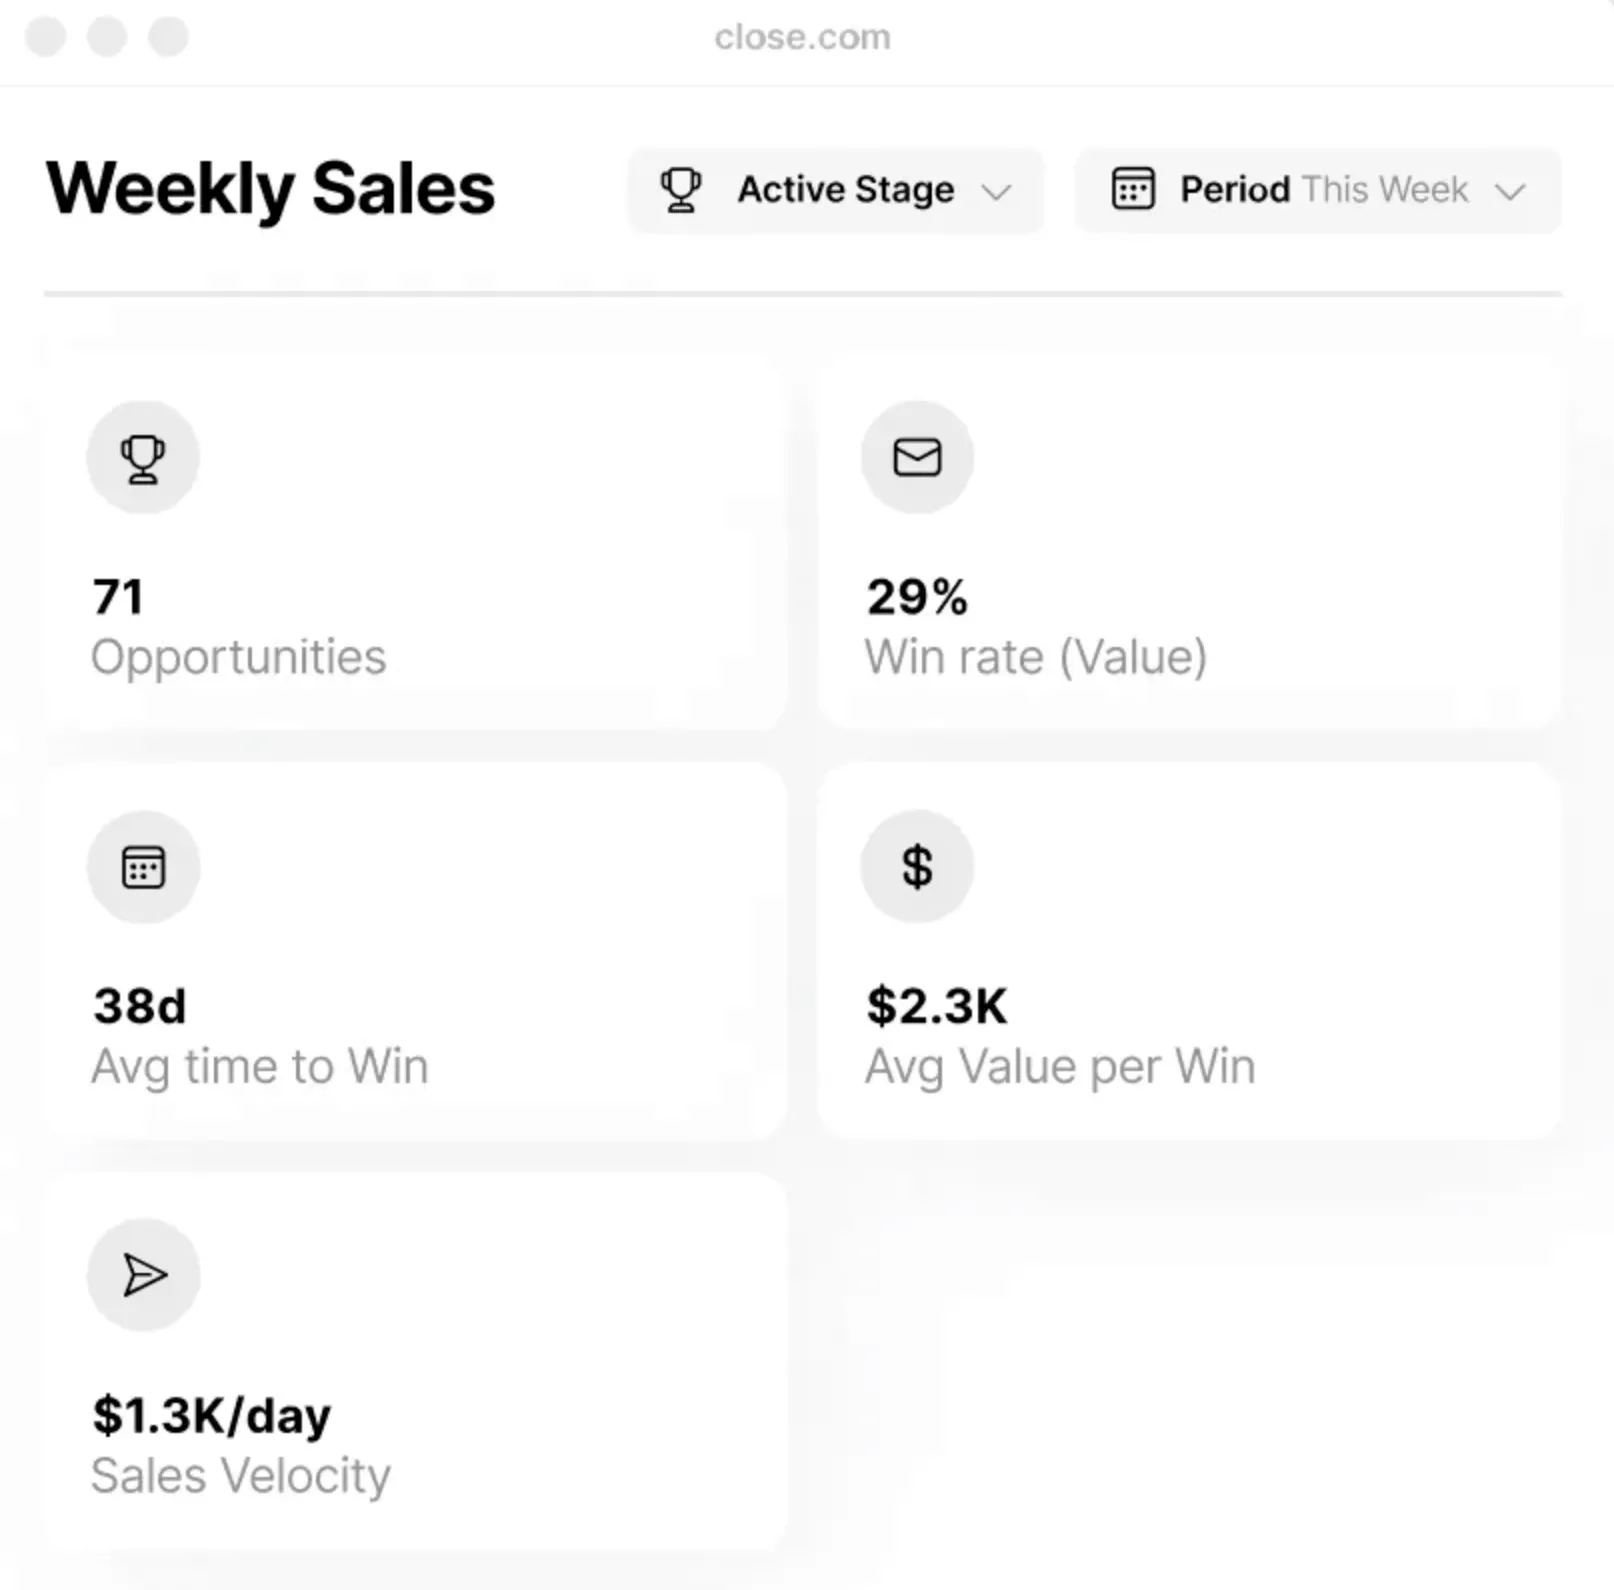
Start With a Sales Report Summary
Most business reports start with an executive summary—there's a reason for that. Decision makers are busy, so it's in your best interest to deliver the most relevant data as fast as possible.
Provide a brief overview of the report, including key highlights and takeaways. What data do you have to share? Why does it mean and why does it matter?
Use all of your top-level sales metrics to create a summary that helps grab attention and tells your audience what to expect so they’re better prepared to process that information.
This could include an initial summary of:
- Total number of sales
- Total sales volume
- Total deals in the pipeline
- Total revenue
If you spot major opportunities or possible challenges, include those as well.
Cut Out the Fluff in Your Sales Reports
It can be tempting to include too much in your sales report. But more isn't always better. Instead of stuffing every bit of data into every report, think about who will see the report and what data really matters to them. In some cases, this might mean creating multiple sales reports for different departments.
If you're struggling to remove data, consider adding a "Trends to Monitor" section at the end. List metrics and changes you're keeping an eye on and what impact they might have in the long term.
 |
Use a Sales Report Template
If you don’t have time to design and format a sales report from scratch, use one of the templates above. There are two main benefits of using a sales reporting template:
- A good sales report template provides a well-structured skeleton so all you need to do is input your data and information.
- This can help save tons of your time and effort, while still ensuring that you end up with a beautiful and organized report.
Automate Your Sales Reporting with a CRM
If your company uses customer relationship management (CRM) software, you can easily use it to generate a customized and detailed sales report.
Traditional tools like Microsoft Excel or Google Sheets are good for storing data and performing complex calculations, but you have to set up formulas and format the sheets from scratch. That's time you could be using to follow up on leads or, you know, scroll Reddit.
A CRM, however, makes it easier to generate a report almost immediately, because it's already tracking and storing your sales data in real-time. Whether you're a startup using a CRM, or a small business owner seeking to improve your bottom line metrics, having great sales reporting is essential to making data-informed decisions about how to best grow your business.
You can easily view any time frame and set custom date ranges, compare to previous periods, and analyze sales rep performance.
By automating parts of your sales reporting process, you can cut down on the time and effort required to put together a report that conveys relevant information in an engaging way.
Most CRMs usually offer several different reports that you can generate and customize to fit your needs.
Ready to Create Better Sales Reports?
Sales reporting might not be your favorite part of the job, but it is crucial to growing your business and closing more deals.
Sales reports show what strategies are working, what strategies aren't, and highlight opportunities for growth. And they help your boss see when you or your team are killing it.
Follow the steps to put together a sales report that conveys the right information and has maximum impact.